
Open and fair finance should come with transparency and open data.
Blockchain activity may be public, but that does not mean the information is easy to find or understand. Across crypto, useful analytics have often lagged behind the products themselves. Data can be scattered, difficult to compare, or only accessible to people with specialist tools. This leaves too much room for speculation, assumptions, and decisions based on feelings rather than data.
We built Rujira Analytics to make important information easier for everyone to access and understand. The dashboards show activity across Rujira Trade and Rujira Swap, as well as the Rujira, bRUNE, and TCY staking dashboards. Anyone can explore the data, follow changes over time, and form their own view of how the ecosystem is developing. By giving everyone access to the same information, we aim to create a fairer opportunity to understand the data and help level the playing field.
This is the first phase of Rujira Analytics. We will continue building on it with dedicated dashboards for Rujira Money Market, Rujira AMM, Rujira Liquidations, and THORChain, along with a broader Rujira ecosystem overview.
The current dashboards already show much more than trading volume. They provide insight into liquidity, market efficiency, protocol revenue, user growth, retention, and staking participation. Together, these metrics help the community understand economic activity across Rujira and THORChain and evaluate progress based on measurable results rather than speculation.

A Clear View of Rujira Trade
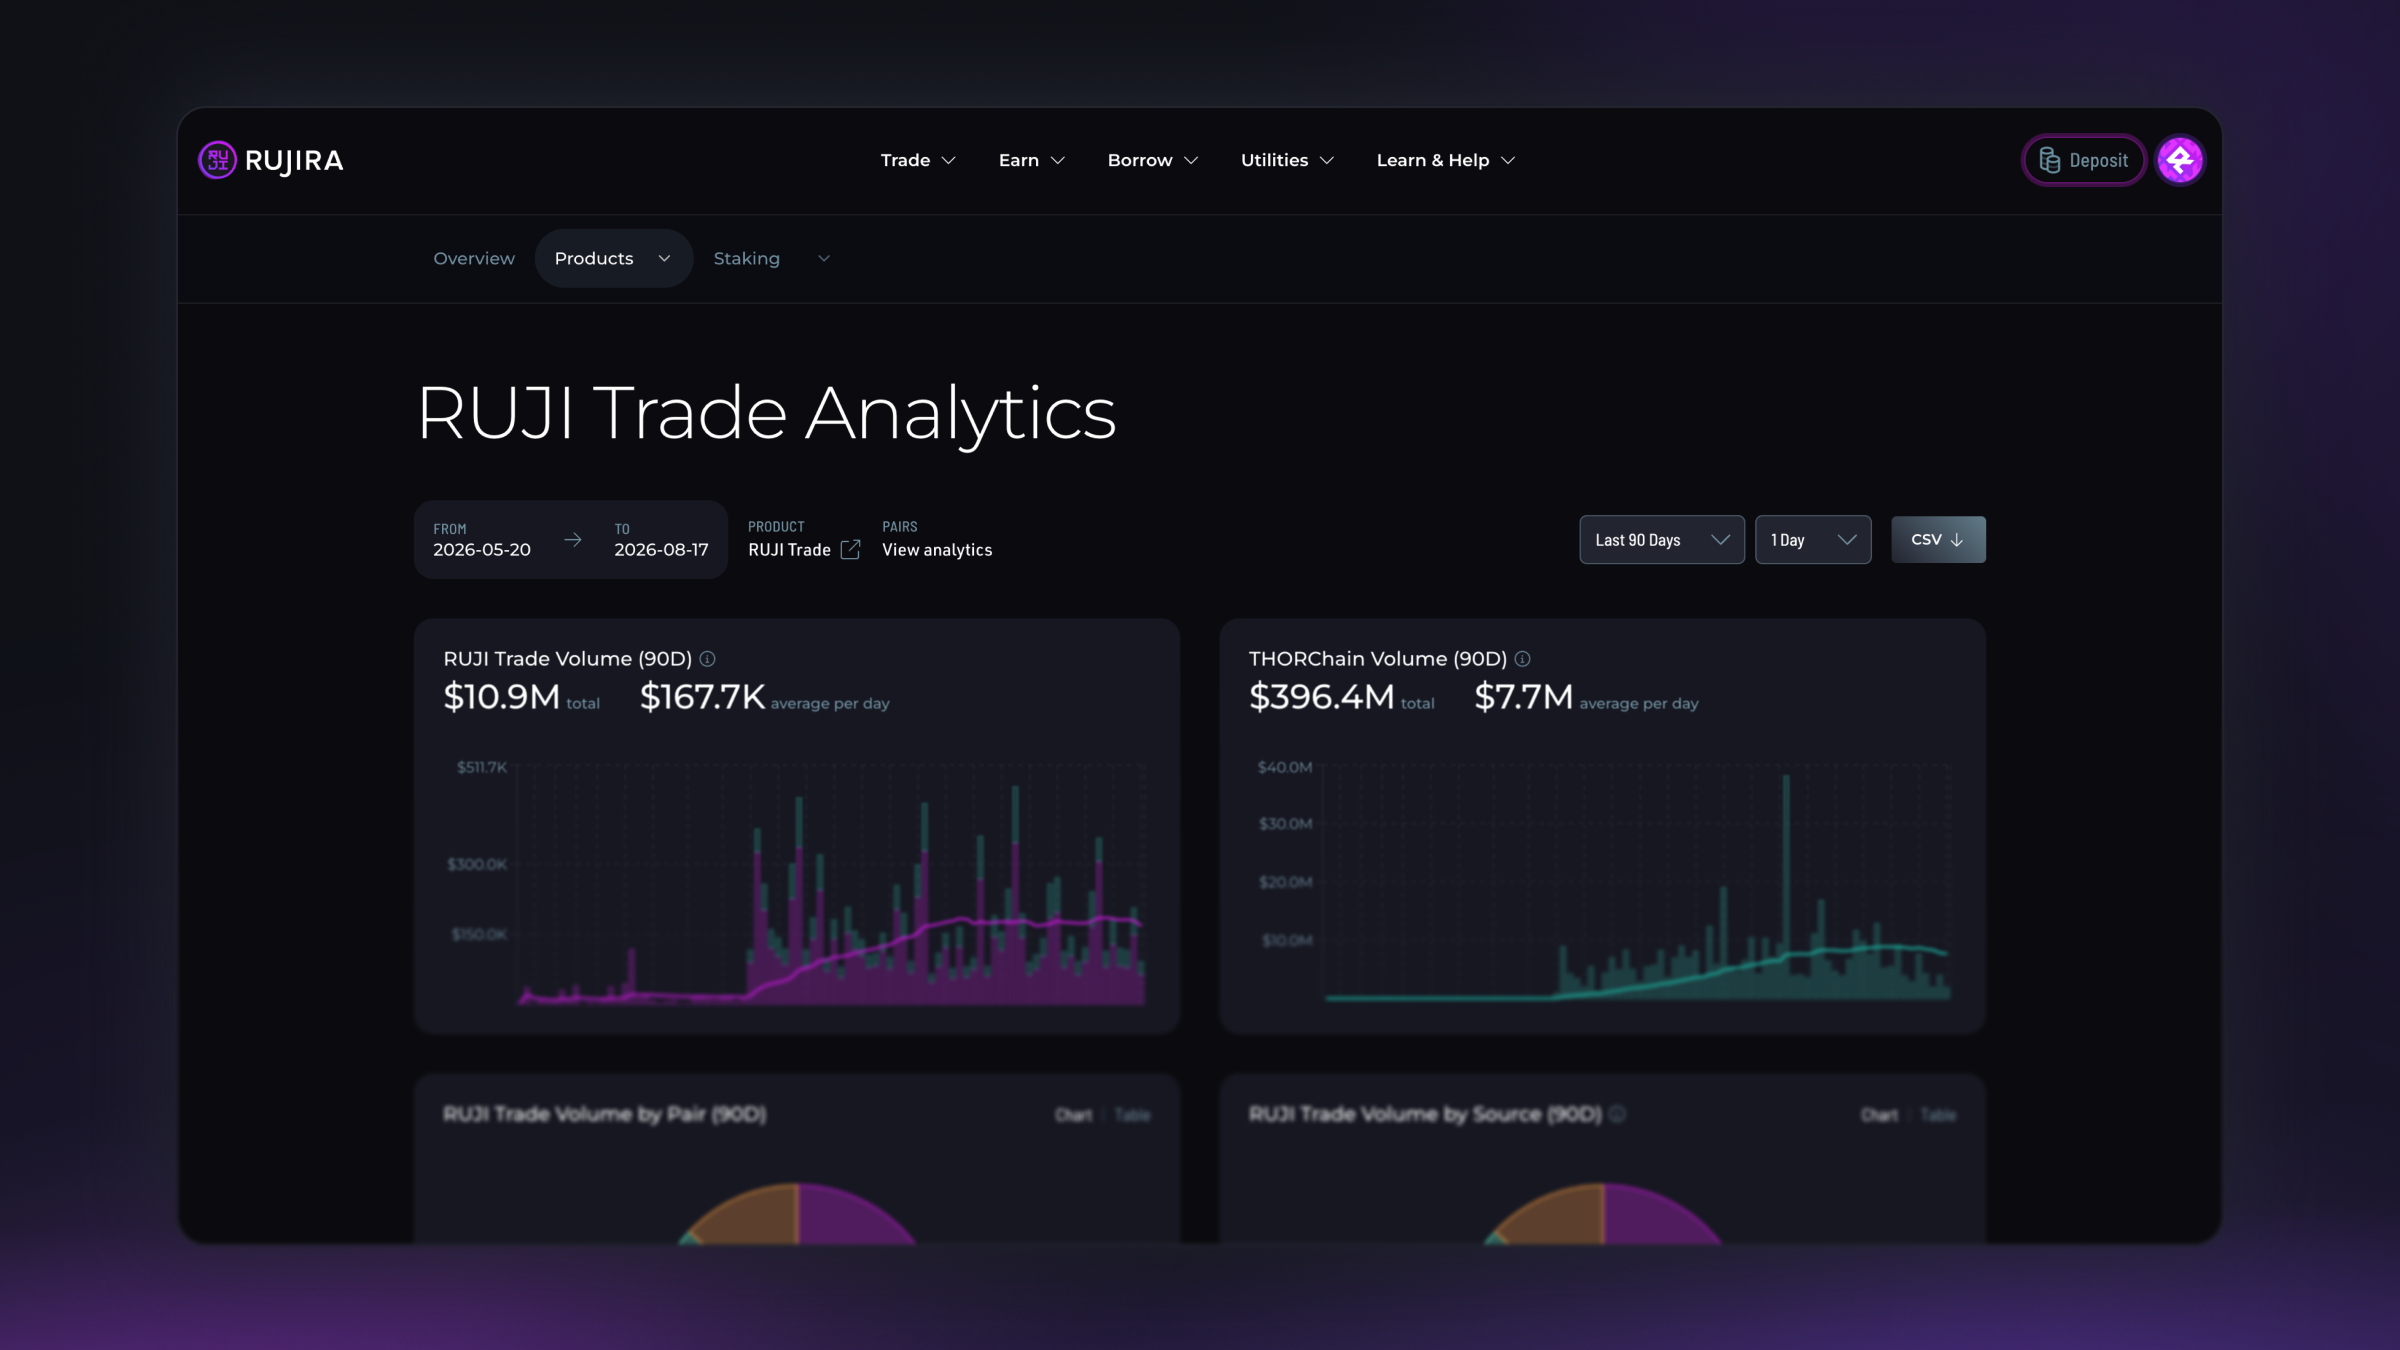
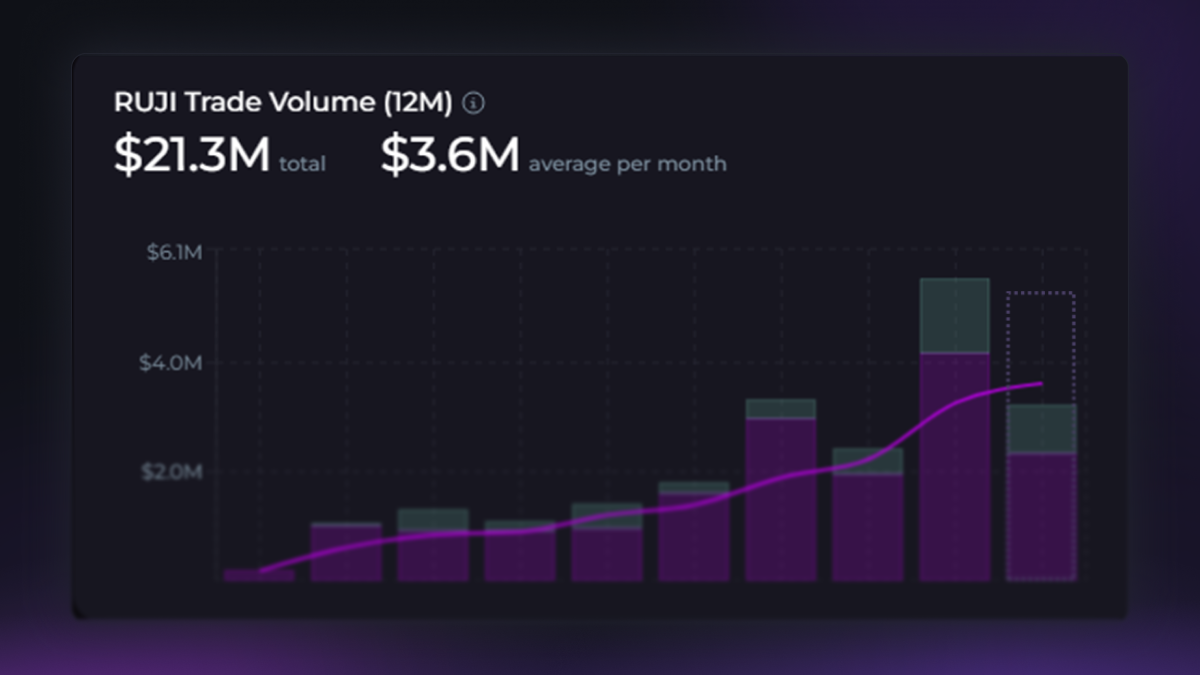
The Rujira Trade Analytics dashboard provides a platform-wide view of trading activity.
You can follow the total Rujira Trade volume, compare it with THORChain volume, and see which trading pairs generate the most activity. Volume can also be separated by source, including manual orders, the Virtualization Strategy, and Automated Trading (CCL).
This breakdown shows how different parts of the trading system contribute to overall activity.
The dashboard also tracks trading fees, arbitrage profits, total protocol revenue, and fees paid by the Virtualization Strategy to THORChain. These metrics help explain how trading activity creates economic value for Rujira and the wider THORChain ecosystem.
Looking Beyond Trading Volume
Trading volume is important, but it does not tell the full story.
A market may generate high volume while using a large amount of liquidity, while another market may produce less volume but use its available capital more efficiently. High volume also does not necessarily mean high revenue, as lower trading fees and lower arbitrage profits can reduce how much revenue that volume generates. The most productive markets tend to find a balance between competitive fees and enough trading activity to maximize revenue.
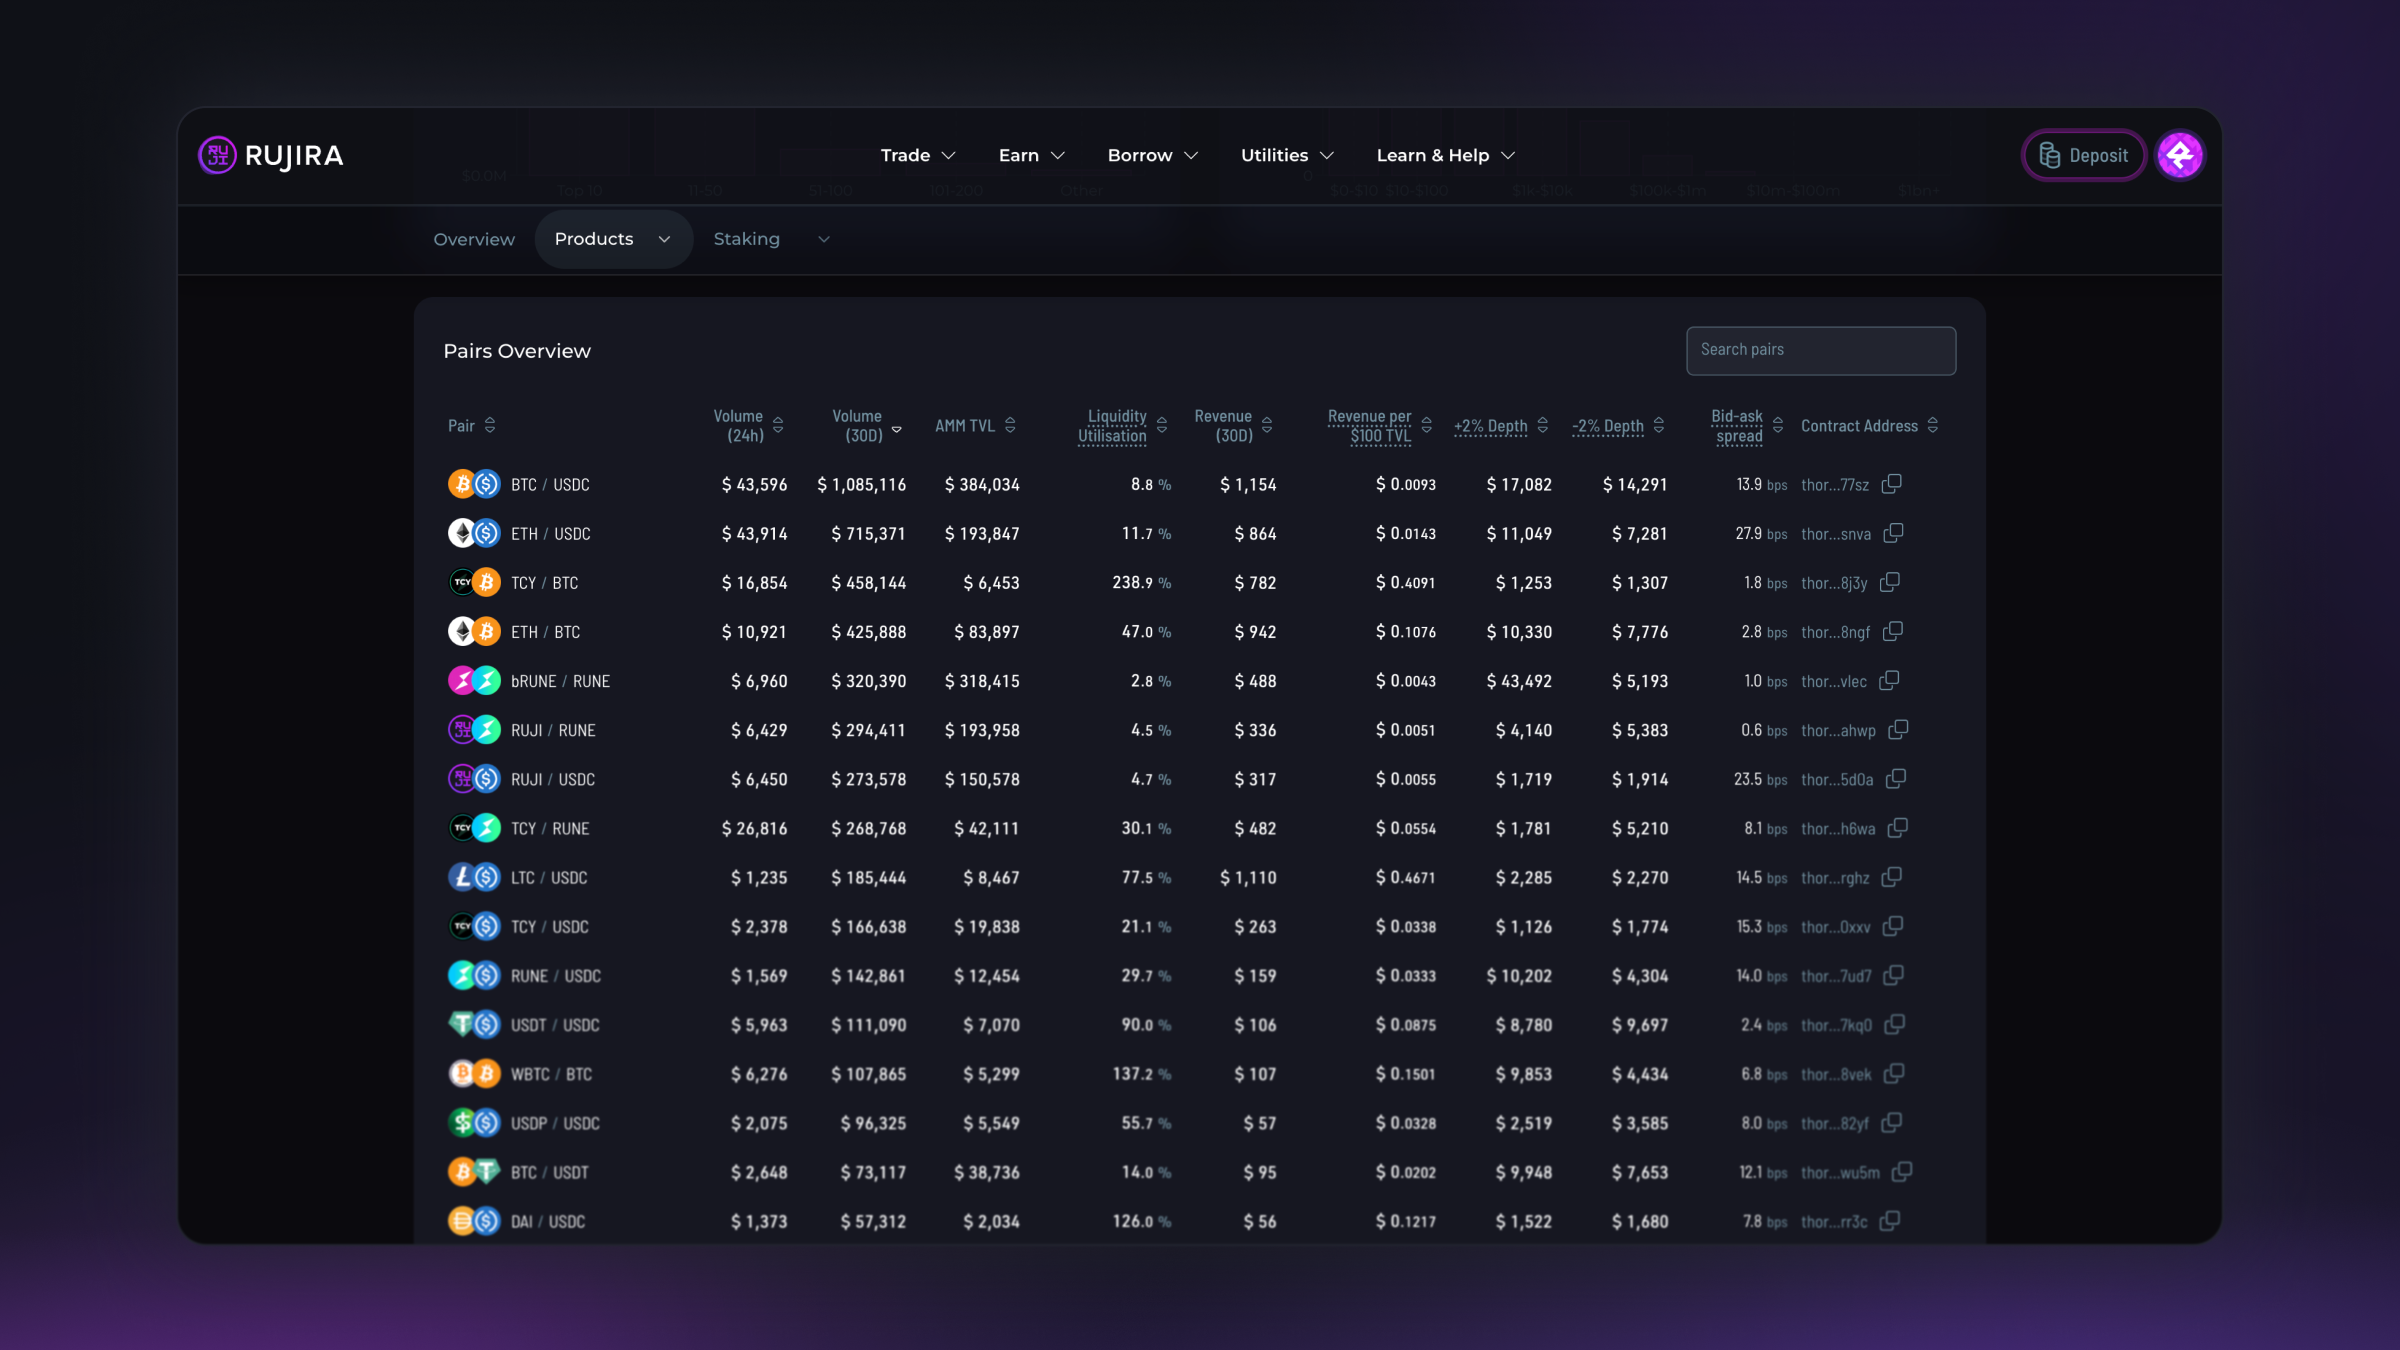
Rujira Analytics includes several metrics that help put trading activity into context.
AMM TVL shows how much capital is deposited in Automated Trading strategies such as CCL.
Liquidity utilization shows how actively the available capital is being used for trading.
Revenue per $100 of TVL helps indicate how productively the available liquidity generates revenue from both trading fees and arbitrage profits.
Market depth shows how much liquidity is available close to the current market price.
Bid-ask spread shows the difference between the best available buy and sell prices.
Deeper markets and tighter spreads can support better execution for traders. Following these metrics over time helps show whether Rujira markets are becoming more efficient as liquidity and activity grow.
Measuring Sustainable User Growth
Growth is not only about volume. It is also about the people using the platform.
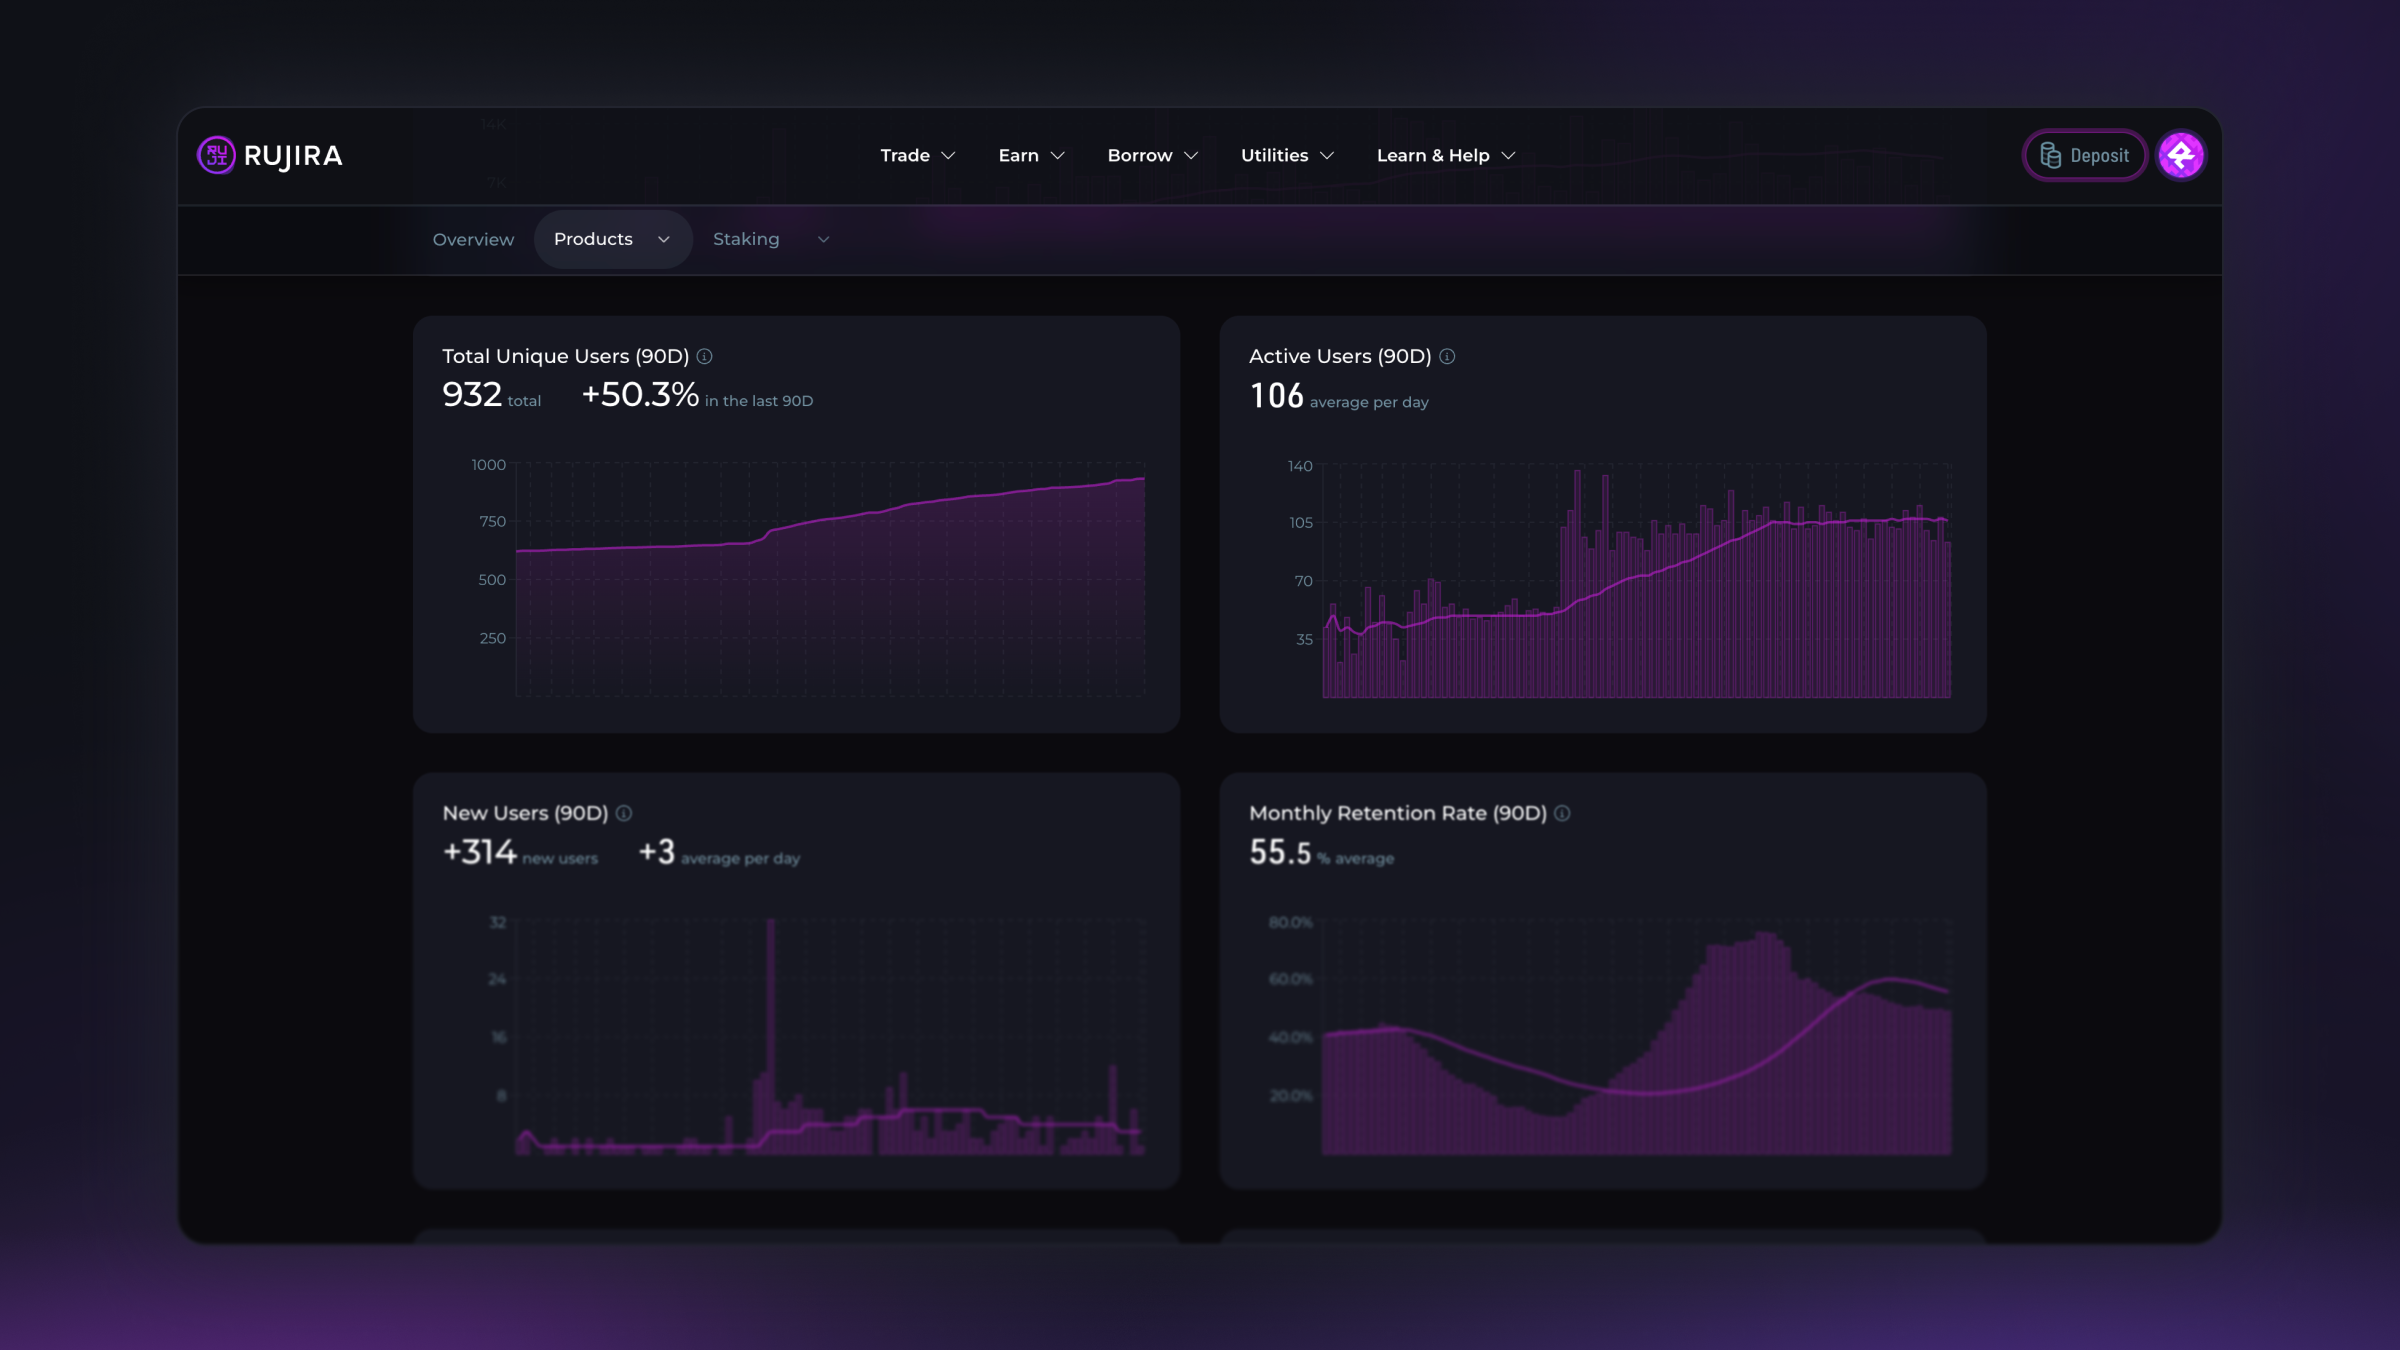
Rujira Trade Analytics includes several metrics that help show whether Rujira is attracting more users and whether they continue to return.
Number of trades shows how many trades were completed during the selected period.
Total unique users show how many different accounts have used Rujira Trade.
Daily active users show how many users interact with Rujira Trade each day.
New users show whether the platform is reaching a wider audience over time.
Monthly retention shows whether people continue using Rujira month over month.
Trader distribution shows whether trading activity comes from a broad group of participants or is concentrated among a smaller number of large accounts.
No single metric can define sustainable growth. Looking at users, retention, trades, volume, and revenue together provides a much clearer picture.
Explore Every Market Individually
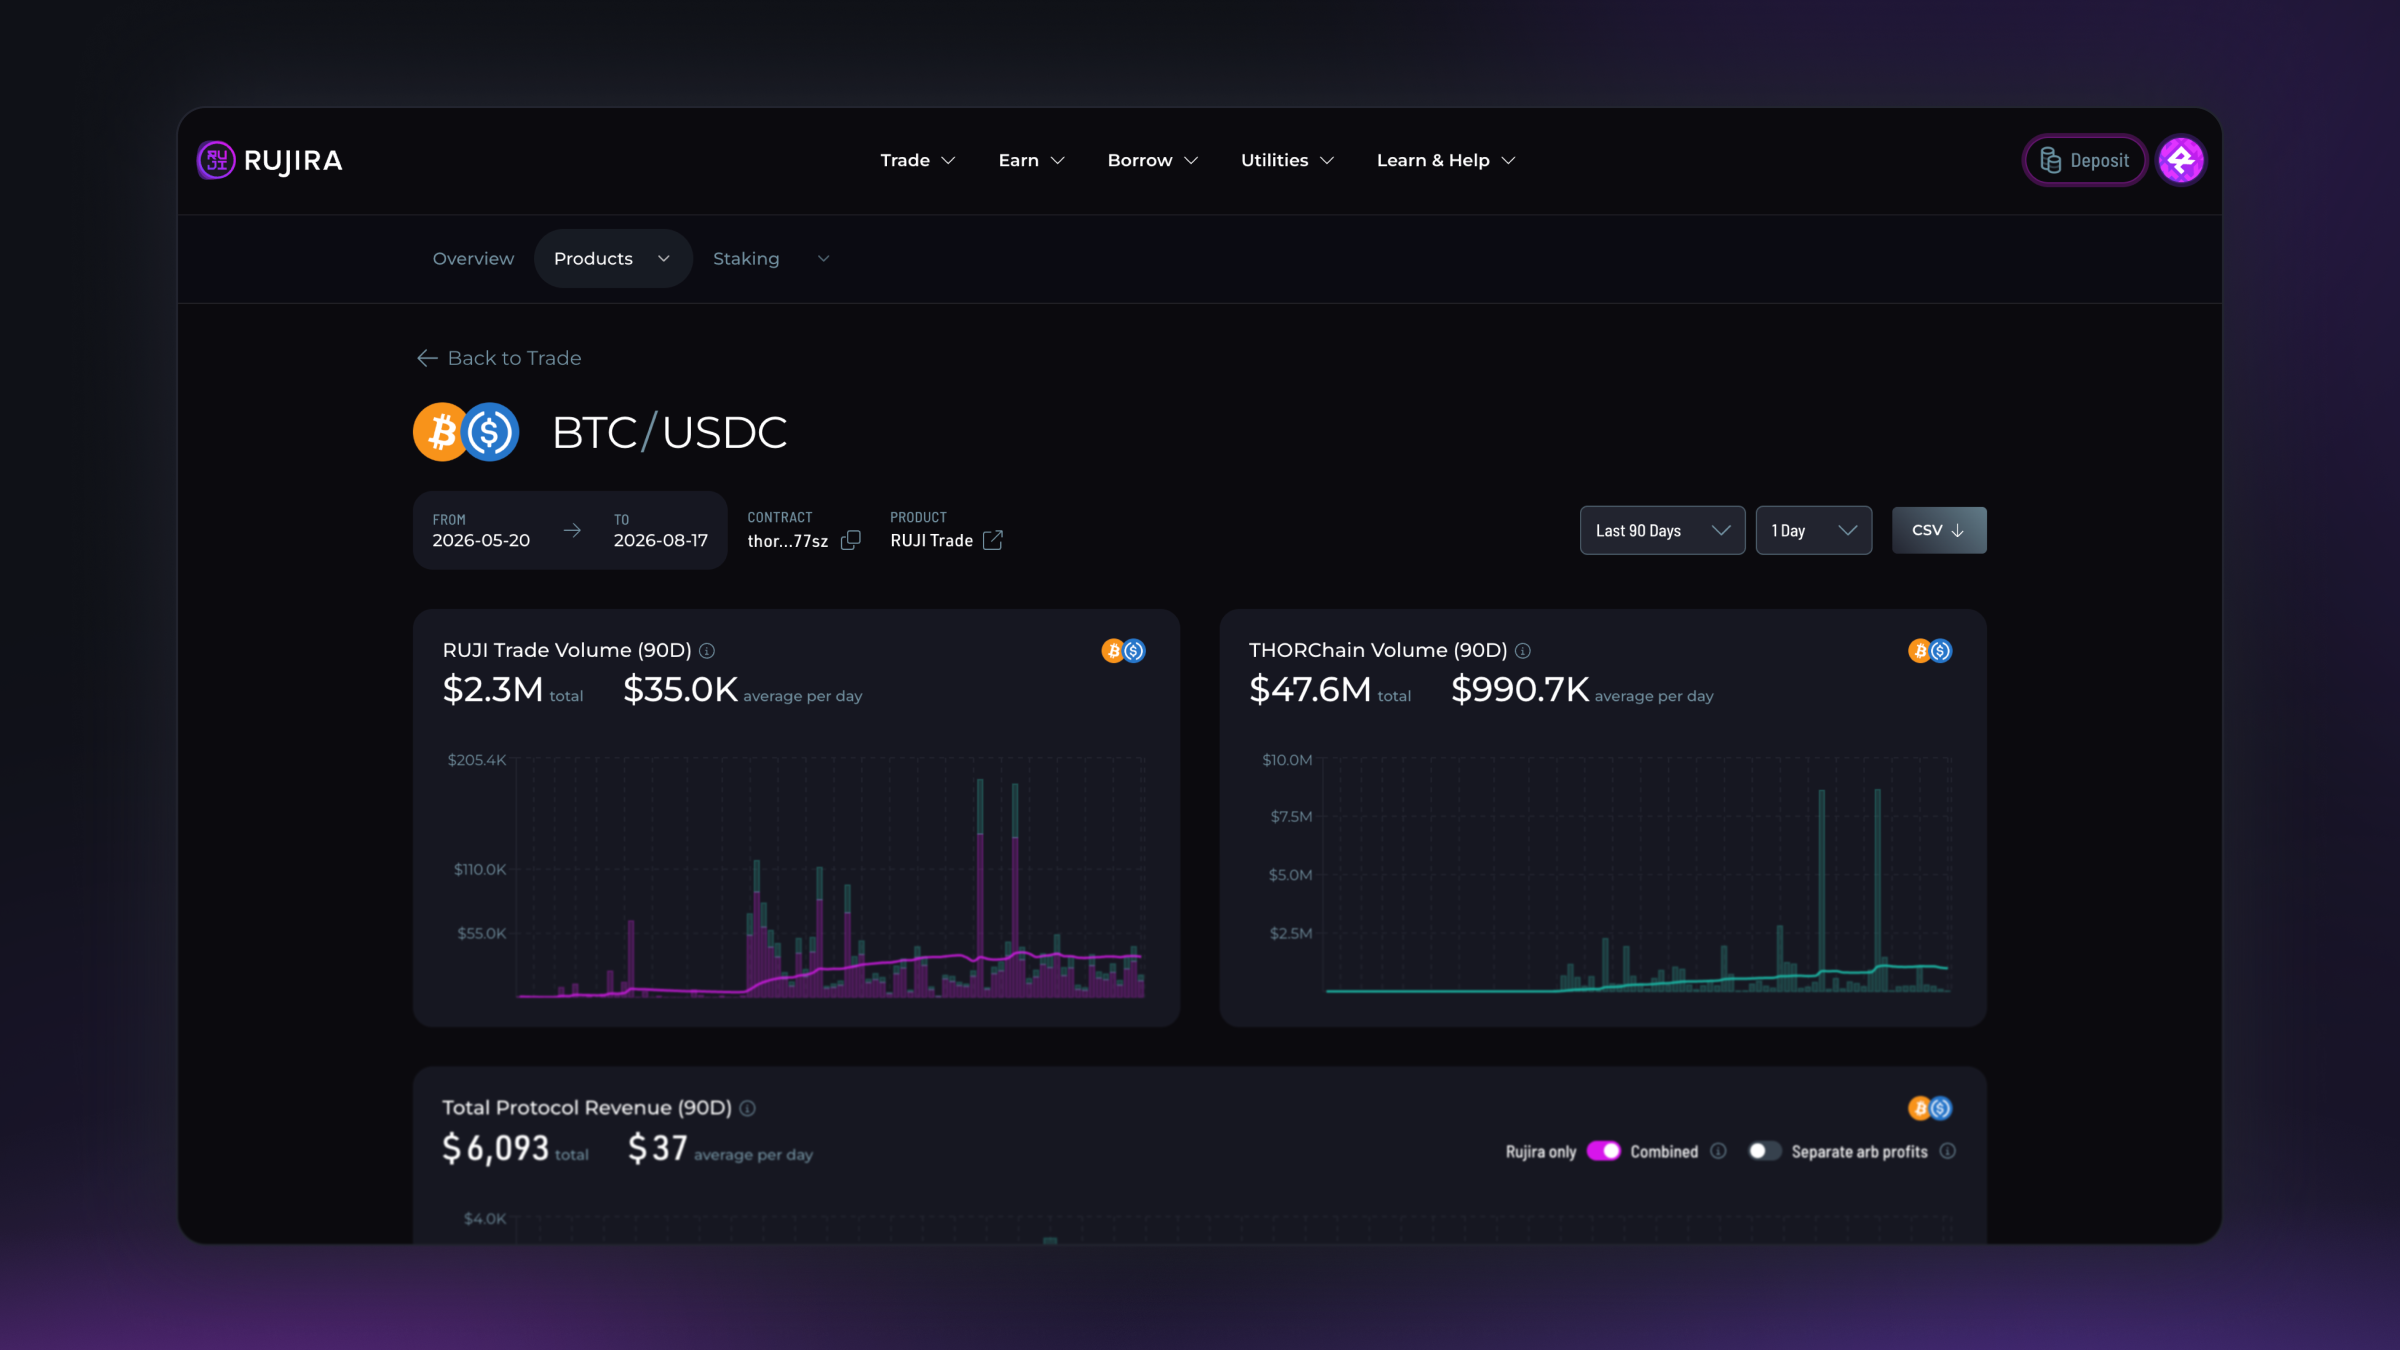
The Rujira Trade dashboard provides a platform-wide overview, while every trading pair on Rujira Trade has its own analytics page.
For example, the BTC/USDC Analytics dashboard shows pair-specific volume across Rujira and THORChain, protocol revenue, revenue relative to volume, the number of trades, AMM TVL, liquidity utilization, and revenue per $100 of TVL.
These individual dashboards let you go beyond platform-wide totals and see how each market is actually performing. You can compare BTC/USDC with BTC/USDT, for example, to see which pair attracts more volume, uses its liquidity more efficiently, or generates more revenue from the capital available. You can also follow the same pair over time to see whether its activity and efficiency are improving or declining.
This can help when deciding where to deploy capital or open a CCL position. Instead of looking at volume or APR alone, you can compare how efficiently different markets are using their liquidity, whether a pair is performing in line with similar markets, and where there may be opportunities that stand out.
New to Custom Concentrated Liquidity? Pragmatic Monkey wrote a very in-depth article that covers everything you need to know about CCL: https://x.com/PragmaticMonkey/status/2087240921964245176
Follow Rujira Staking Activity and Revenue
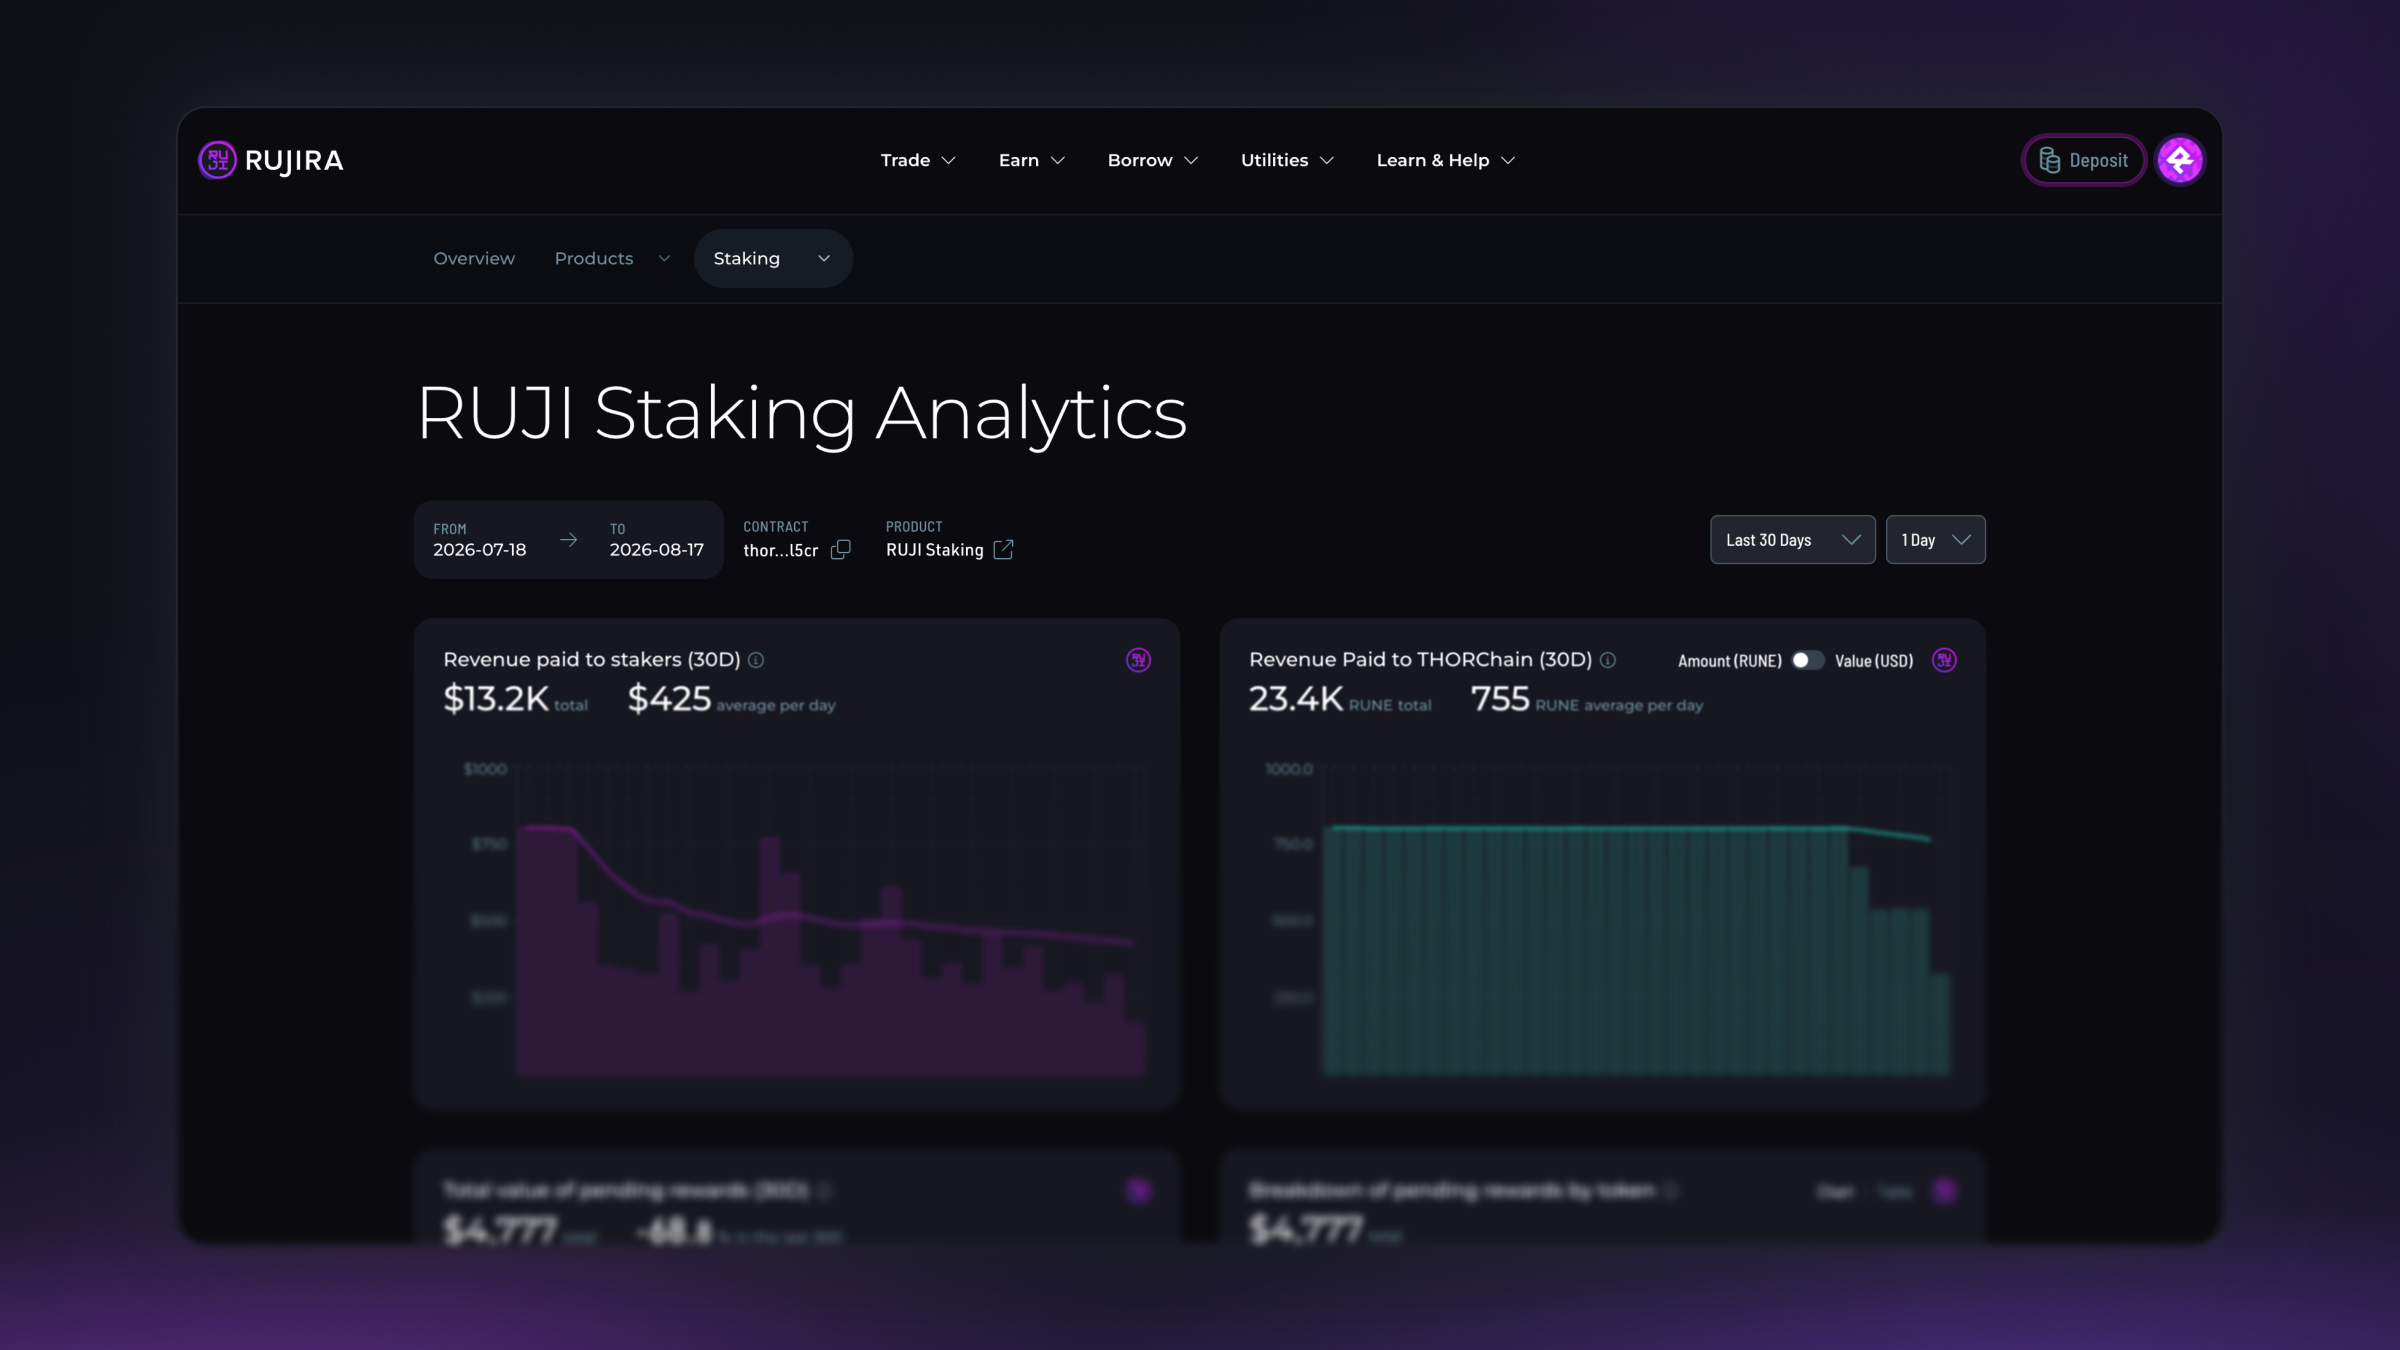
The Rujira Staking Analytics dashboard shows staking participation and the economic activity connected to Rujira staking.
Users can follow revenue paid to stakers, revenue paid to THORChain, pending rewards, the amount and value of Rujira staked, and the percentage of the total supply participating in staking.
Deposits, withdrawals, and net flows show how staking participation changes over time. The dashboard also compares the historical APR for yielding positions with the APY for auto-compounding positions.
Pending rewards are displayed by asset, providing a clearer view of the different tokens contributing to staking revenue.
Dedicated Analytics for bRUNE and TCY
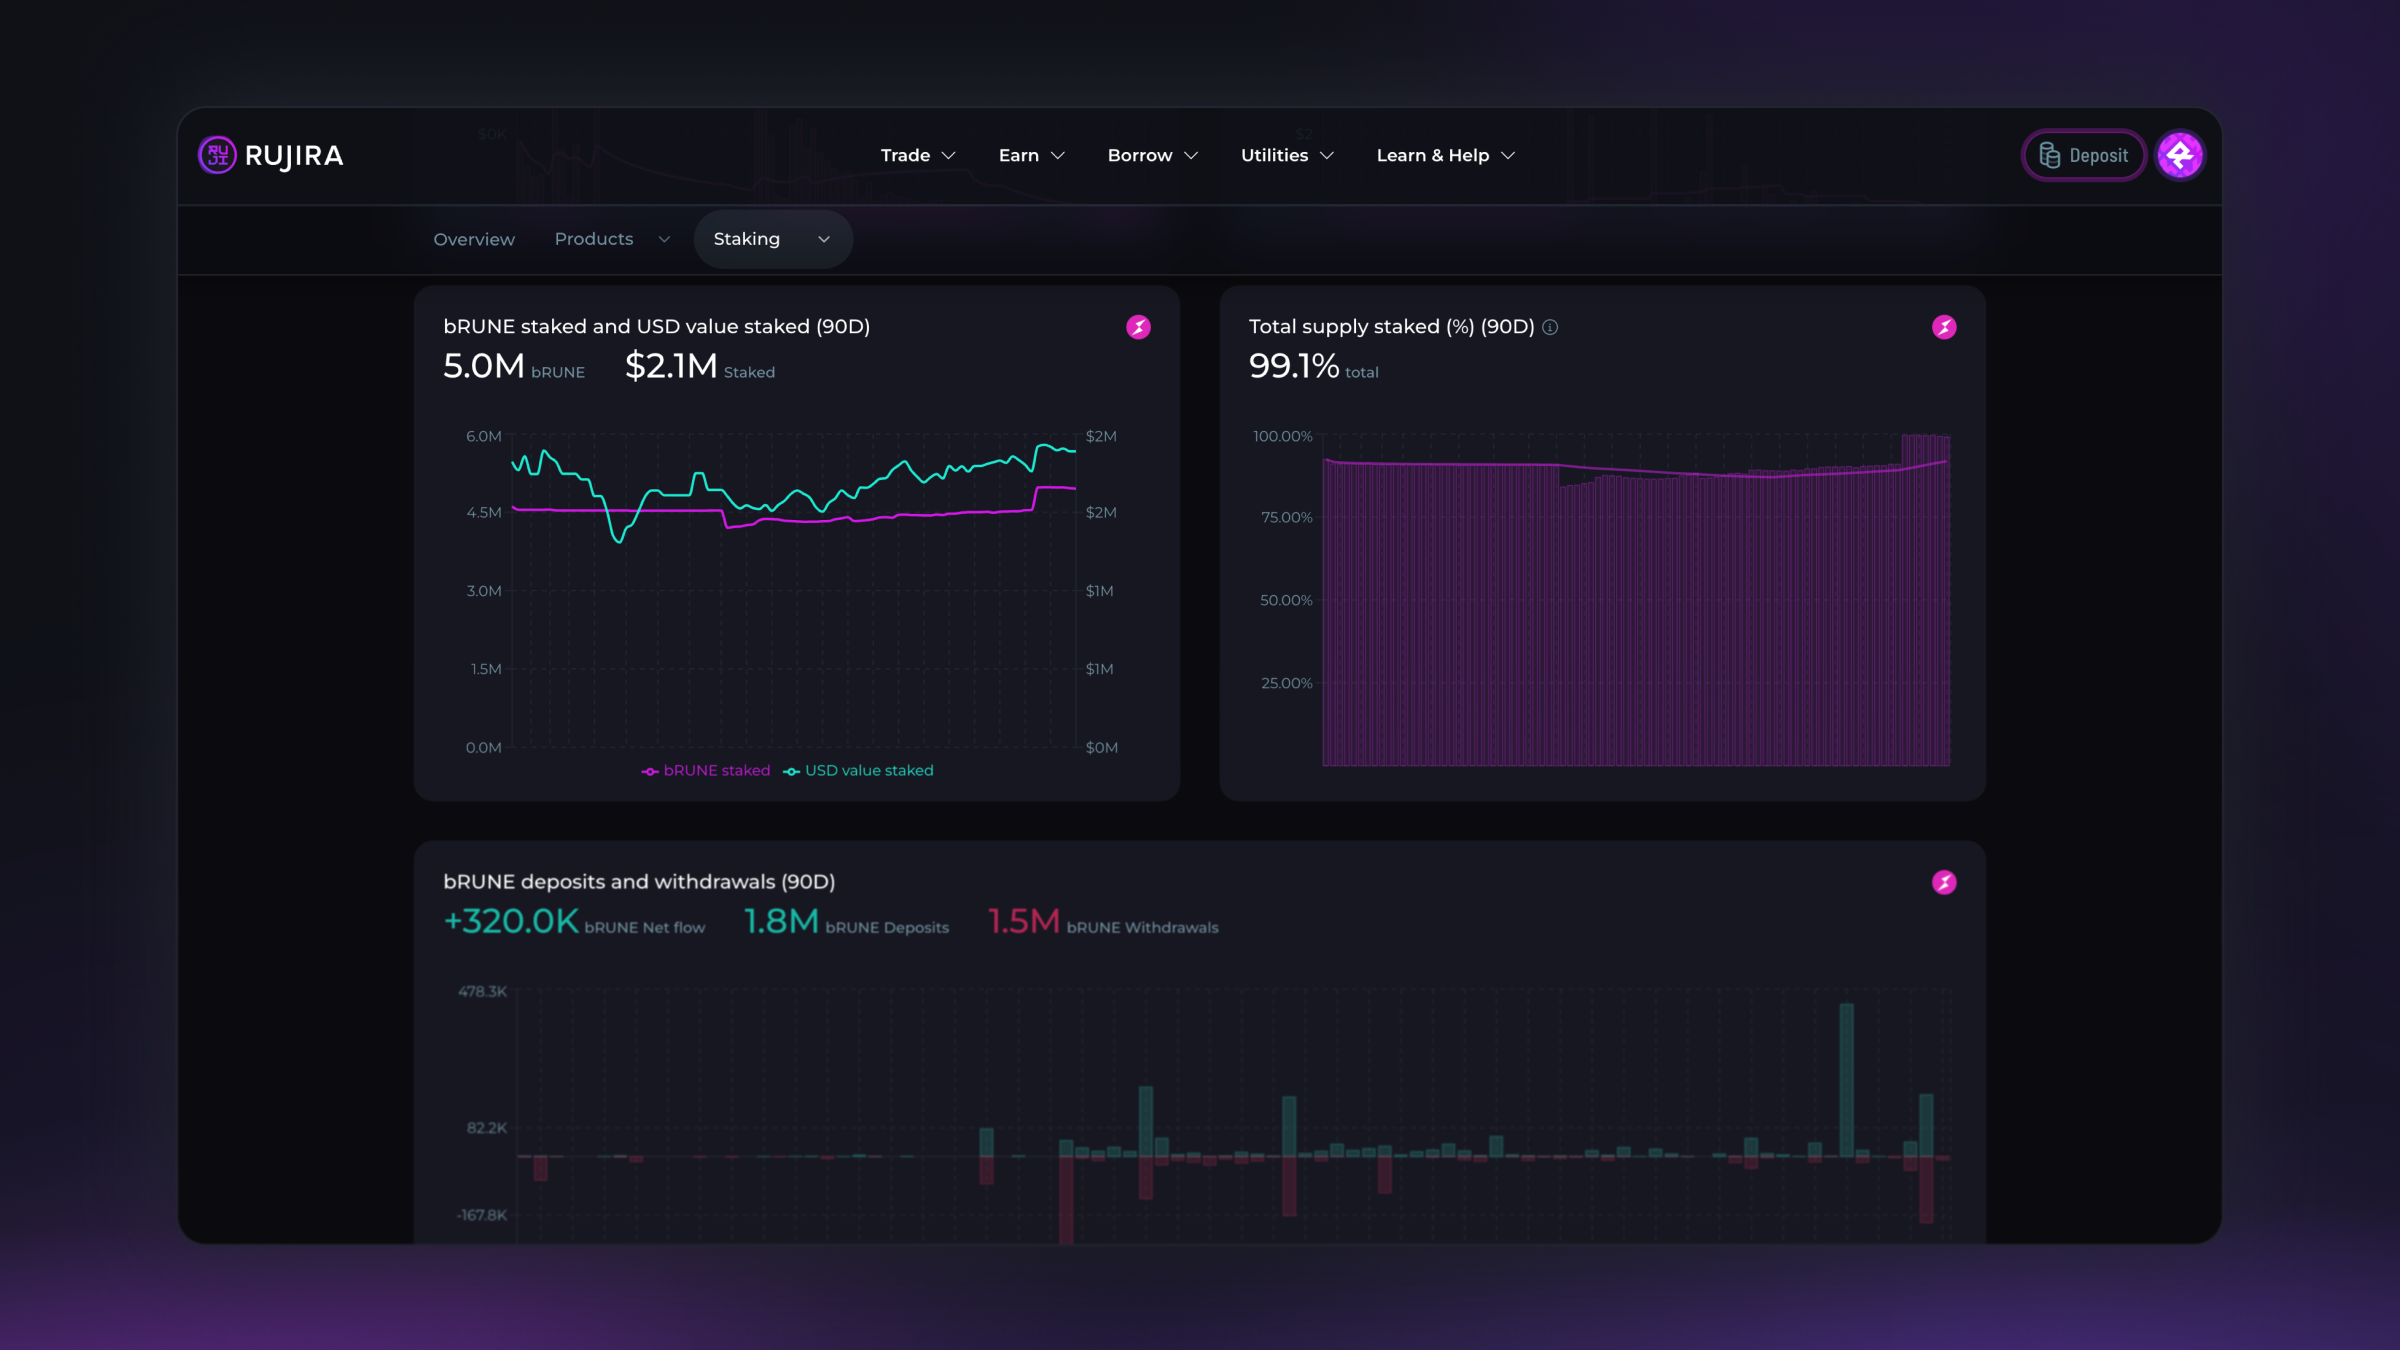
bRUNE and TCY each have their own staking dashboard.
The bRUNE Staking Analytics dashboard tracks revenue paid to stakers, protocol revenue, the amount and value of bRUNE staked, the percentage of supply staked, deposits, withdrawals, net flows, and historical staking APR.
The TCY Staking Analytics dashboard provides similar insight into TCY participation, including revenue paid to stakers, the amount and value staked through Rujira, the percentage of supply staked, staking flows, and historical APR.
The TCY dashboard covers TCY deposited through the staking contract deployed on Rujira. Keep this scope in mind when interpreting supply participation and other staking metrics.
Follow Trends, Not Just Individual Days
A single day can be influenced by temporary events, large trades, or changing market conditions. Longer periods provide better context.
Rujira Analytics allows users to explore different time ranges, including the last 30 days, last 90 days, last 12 months, year-to-date, last month, and all-time data. Available chart intervals adjust based on the selected period.
Rujira Trade Analytics data can also be downloaded as a CSV file, making it easier for users, analysts, and community members to conduct their own research.
Explore Rujira Analytics
Transparent analytics give the community a direct view of what is growing, what is becoming more efficient, and where there is room to improve across trading activity, liquidity, market quality, protocol revenue, user growth, and staking participation.
Explore Rujira Trade Analytics, Rujira Staking Analytics, bRUNE Staking Analytics, and TCY Staking Analytics.
Fair by design. Owned by you.