Before going into the weeds, make sure you are up to speed with part 1 where we covered the basics: https://x.com/PragmaticMonkey/status/2046311841023091194
This piece is gonna be a bit heavy, but I wanted to put it all into one comprehensive guide I can use for future reference. Worth a read if you are keen to use CCL in your trading.
As usual, none of this is financial advice, just sharing my personal opinions, analysis, experiences, and the trade-offs as I see them.
Creating a CCL position: Step-by-step guide
Creating a CCL position comes down to 5 simple steps:
1) Choose the pair you want to trade.
2) Set the range Low and High based on your investment horizon and your view of the market.
3) Set the Spread and Fee.
4) Create your position.
5) Monitor the performance of your position.
Step 1: Choose the pair you want to trade
The very first step is to decide which pair(s) you want to trade. A few guiding principles:
1) As a rule of thumb, you should only trade pairs where you are happy to hold both assets (BASE and QUOTE) for the long term.
This is probably the most important point when creating a CCL position, if price moves outside your range, you will end up holding either ~100% BASE or ~100% QUOTE, whatever has been the underperforming token relative to the other.
This phenomenon known as Impermanent Loss (IL) has a bad rep in DeFi, but in my view that reputation is often misguided. IL is a feature, not a bug, you can embrace it to average down or take profits on your conviction bets, while generating yield when the price is in your range. But of course, that only makes sense if you are happy to hold both assets in the pair, hence the importance of pair selection.
2) Pairs quoted in stablecoins (e.g. BTC/USDC) will often generate higher returns and offer better downside protection in a bear market than pairs quoted in tokens (e.g. ETH/BTC).
As a market maker, what drives your profit is volatility. Pairs denominated in stablecoins typically have higher volatility than pairs denominated in another volatile token, hence higher profit potential.
The stablecoin part of your position, that will be used to average down on the base asset when price moves down, will offer you a partial hedge in case the market goes against you (but it will also reduce your upside if the market moves in your favor).
That’s the positive side of IL: sure, with hindsight, if price goes up you would have been better off just buying & holding BTC, but when price moves against you, the same mechanism mitigates your loss.
3) Pairs quoted in tokens (e.g. ETH/BTC) are a good way to retain more upside in case of a bull market, but will likely generate lower yield.
That is the corollary of point #2, a pair composed of two correlated assets will have a lower volatility, hence lower returns.
As both tokens in the pair are crypto assets, you will retain better market exposure (in $ terms) if prices go up, but you won’t benefit from the downside mitigation that pairs quoted in stablecoins offer.
If you are unsure which pair to choose, the best starting point is usually high-liquidity large-cap tokens (BTC, ETH, SOL, etc.) paired with USDC or USDT. In my experience, they offer the best risk-adjusted returns.
I would stay away from doing CCL with low-cap tokens. If you decide to do it anyway, best to use very wide ranges, so you won’t miss out as much if price goes in your favor. But really, large cap, established tokens are much better candidates if you intend to treat your trading as a business.
Side note before we continue: I have built a backtesting engine to guide my own decisions and illustrate some of the points I’ll be making in the following sections. The backtester is designed to closely mimic RUJI Trade and CCL mechanics, but the data I used are 1-minute candles that commingle base layer trades and app layer trades. This results in overly optimistic APR vs. what is realistically achievable in the early days. This will get better over time as (i) we improve the Virtualization Strategy and reduce frictions in liquidity transmission between base layer and app layer (mostly done since ADR-31), and (ii) once we launch the DCL strategy that will reprice every block based on enshrined oracles.
I was reluctant to share any numbers, but will do it because those offer valuable insights. The important thing is to look at the shape of the distribution rather than absolute numbers. The numbers themselves are just a glimpse of what could be achievable in the longer term, assuming similar market conditions.
Step 2: Set the range Low and High
Assuming you have chosen a pair that fits you, setting the range is the most important decision you will have to make.
There are many different approaches you can take depending on your investment horizon and your views on where the market is likely to go. No right or wrong answers, it simply depends on your personal views and your objectives.
Fundamentally, there are three things to understand:
There is a balance to find between tightness of the range and sustainability of returns. At a given price within your range, your inventory of BASE and QUOTE is determined by that price. So if price moves and later comes back to where it started, your inventory will also come back broadly to where it started (+/- rounding difference that compound as price move back and forth inside your range). You need to understand what happens when the price gets out of your range and incorporate that into your strategy.
1) There is a balance to find between tightness of the range and sustainability of returns.
Your position will only generate yield from trading while the current market price is inside your range. From the moment price gets out, it means you run out of inventory on one side and can no longer trade.
The tighter your range, the harder your capital works (= the larger your size per trade) and the higher your yield, but also the higher the probability that the position will get out of range and stop generating any return.
A tight range also means you won’t be averaging down or taking profit at a price that is much different from current price. Therefore, if price continues to move further away, once out of range, you will end up holding the underperforming asset at a price that might not reflect what you would have been happy to pay (if price falls below your range low), or what you would have been happy to sell for (if price rises above your range high). From there, you might have to wait for an extended period before price comes back inside your range, and there is no guarantee it will.
Your only way to get back into an active position would be to sell at a lower price than what you bought for (if out of the range by the bottom), or buy back at a higher price than what you sold for (if out of the range by the top). That’s when the infamous Impermanent Loss becomes permanent: you would realize a capital loss, which is generally something you want to avoid unless it still fits your broader thesis and plan.
Bottom line: don’t get lured by very high APR on very tight ranges, it looks great while you are in, but it’s unlikely to last. If you are getting started, better be more conservative and target lower but more sustainable APR on wider ranges.
To illustrate the points, here is an analysis showing the APR on the BTC/USDC pair at various levels of range tightness, keeping all other parameters the same.
To compare scenarios, I came up with the “Tightness Factor” as a normalized measure of liquidity concentration (ranging between 0 and 1). It's simply calculated as: Tightness Factor = Low/High:
The closer to 0, the wider the range The closer to 1, the tighter. 257-day backtest: BTC/USDC | 40 bps spread & fee | APR at various levels of range tightness
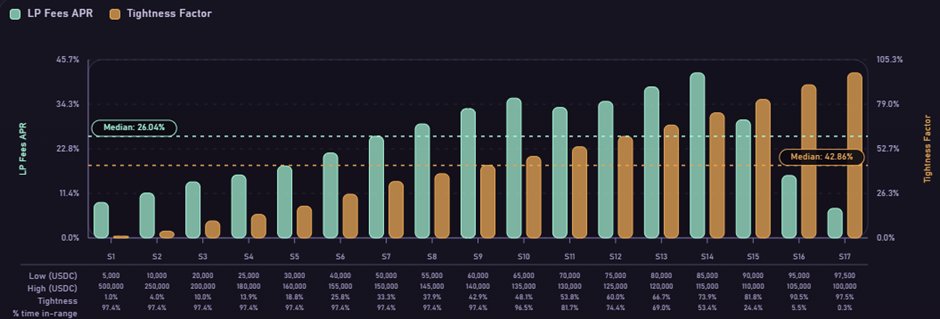
You can see in this backtest over a 257-day window that the APRs distribution forms a sort of double top. It peaks a first time at a tightness factor of around ~48% (65k-135k USDC range), then starts to decline, then picks up again at a tightness factor of around ~74% (85k-115k USDC range), before sharply declining as ranges get really tight and the % time in range starts dropping materially.
It’s easy to say with hindsight that the optimal range for this period would have been 85k-115k USDC, but this doesn’t guarantee in any way that it will be the optimal range going forward, and the tighter your range, the more likely you are to be off in the future.
Another interesting analysis is to look at the distribution of returns over the period for two scenarios with roughly the same APR, but with significantly different tightness.
Let’s compare scenario 4 (range: 25k-180k USDC | tightness: ~14%) and scenario 16 (range: 95k-105k USDC | tightness: ~90%) which have almost exactly the same global APR of ~16%. Let’s compare the consistency of the APR over time by chunking the period into 18 sub-periods of ~17 days with 20% overlap (~3 days) to smooth the numbers and get more datapoints.
Scenario 4: Range 25k-180k USDC | Tightness: ~14%
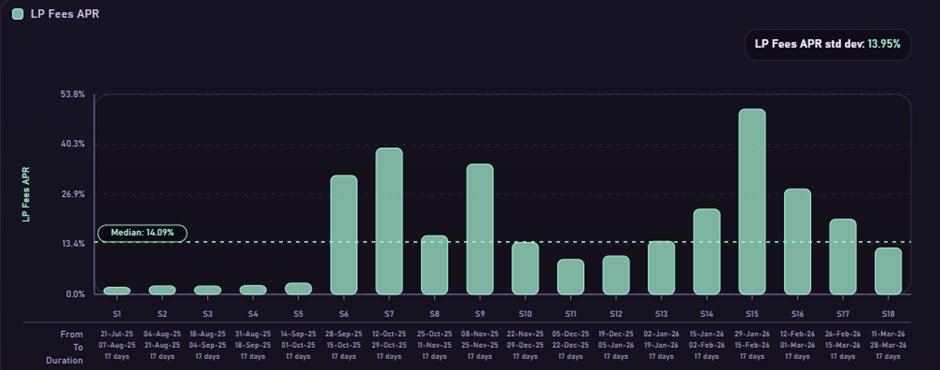
Scenario 16: Range 95k-105k USDC | Tightness: ~90%
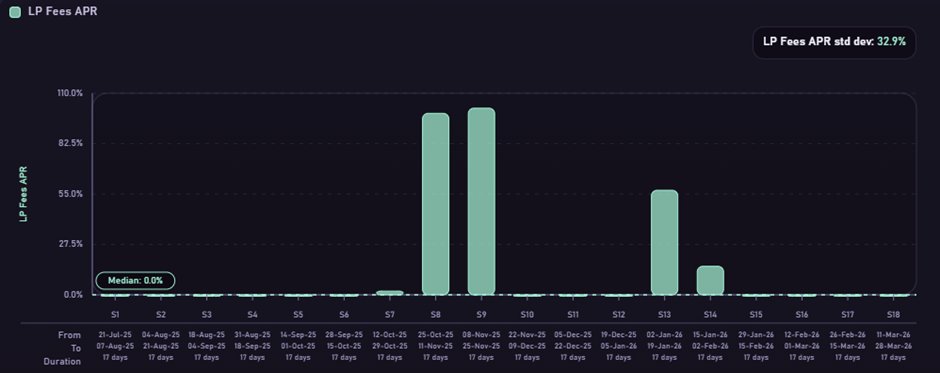
While the global APR over the 257-day period is almost the same, you can see the distribution is widely different between the two scenarios.
Scenario 4 remains in range throughout the period and generates some yield every sub-period, with some variability which is totally normal given the cyclical nature of volatility, but at least a bit every period.
Scenario 16, in contrast, is out of range 14 periods out of 18. It has 4 periods of very strong performance, but doesn’t yield anything the rest of the time, almost 200 days off out of a sample of 257 days.
In the spirit of treating your trading as a business, the wise choice is to favor the first case: lower but more stable/predictable returns over time. It’s about making your business resilient, and able to continue operating across a broad range of market conditions.
2) At a given price within your range, your inventory of BASE and QUOTE is determined by that price. So, if price moves and later comes back to where it started, your inventory will also come back broadly to where it started.
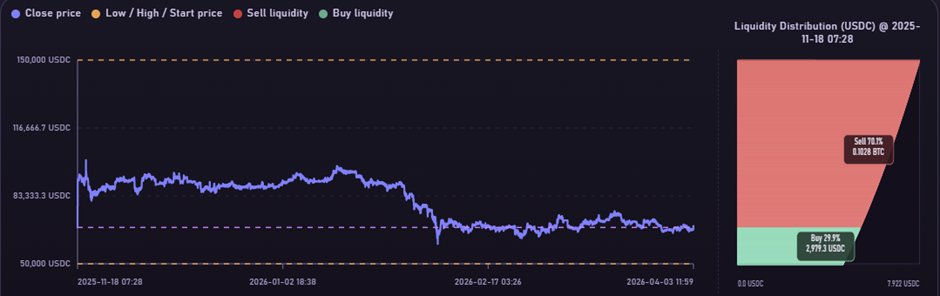
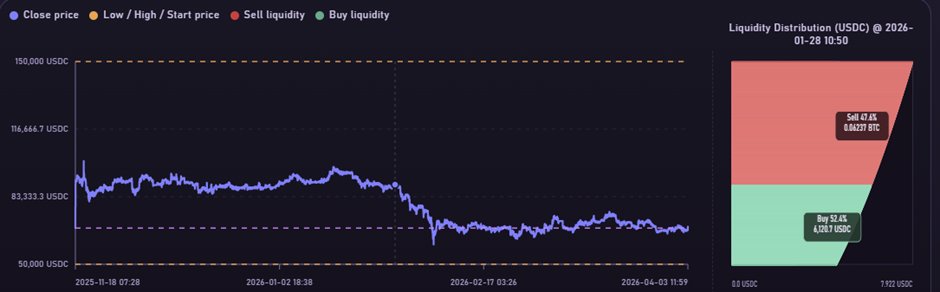
This is a simple but very important element to understand. Let’s illustrate with an example: below, we are looking at a BTC/USDC position with a 50k-150k USDC range over a ~136-day period. I chose the period using a feature I called “Longest Round Trip” in the backtester. What it does is find the longest period within the full dataset where the ending price returns very close to the starting price.
Importantly, I have set the Fee parameter equal to the Spread, meaning 100% of the trading profits are streamed out of the position (more on that in a bit) while the principal remains intact. You can see:
At the start of the period, BTC price is 67,845 USDC --> The starting inventory comprises 0.1028 BTC and 2979 USDC (~70.1%/29.9%): BTC and USDC inventories at the start of the period (BTC price: 67,845 USDC)
Towards the middle of the period, BTC price has risen to 89,296 USDC --> The inventory now comprises 0.06237 BTC and 6,121 USDC (~47.6%/52.4%): BTC and USDC inventories in the middle of the period (BTC price: 89,296 USDC)
At the end of the period, BTC price is back to almost where it started at 67,879 USDC --> The ending inventory comprises 0.1021 BTC and 3,024 USDC (69.6%/30.4%) which is almost identical to the starting inventory. So, during the roundtrip period, your capital has been preserved, and you have earned a profit by trading the volatility. That’s your compensation for taking inventory risk.
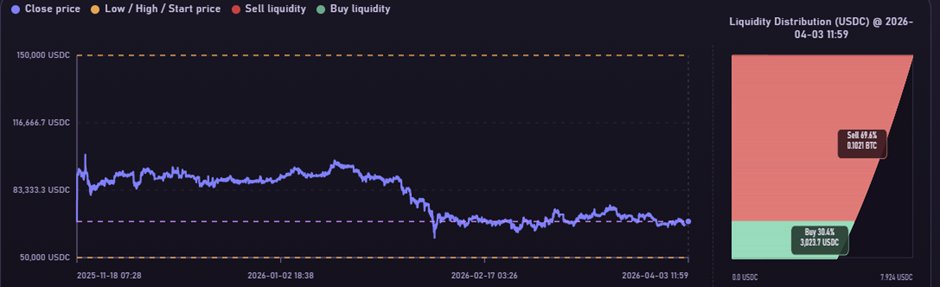
This “Longest Round Trip” feature is very useful for testing positions performance in isolation from impermanent loss, which is a valid assumption to make if you have chosen a pair composed of two assets you are happy to hold, and have set a range that suits you.
The underlying assumption is that, throughout your investment period, you are confident that the price of the base asset (BTC), while fluctuating, will at least come back to the level where you started. If you don’t think it will, you should not trade this pair in the first place.
There are 3 possible outcomes when you close your position:
If the price is back at its starting level, you will have conserved your principal (initial inventory of base and quote) and you will have made a net profit equal to the yield you generated from trading the volatility. If the price is above its starting level, you will have done well on both sides: from the yield you generated, and from the capital gain on your principal (measured in USDC) as the strategy automatically took some profits on the way up (selling BTC for USDC). If the price is below its starting level when you close your position, you will realize a capital loss on your principal (measured in USDC), but you will end up with more BTC than you started with. You will have been automatically averaging down on your position (buying BTC for USDC), and your loss in USDC terms will be at least partially mitigated by the yield you generated during the period. If you chose your pair wisely, this outcome is still acceptable because you now hold more BTC than you started with, and you chose BTC/USDC because you believed in the long-term success of BTC and are happy to accumulate more.
If you made calculated decisions in line with your market views and preferences when you created your position, you win in all scenarios, even if they will not all look equally attractive in quote terms.
The main risk (besides standard smart contract risk) is that one of the assets in your pair drops to 0 and never recovers. In that case you will have lost your capital, and that is why pair selection is a critical part.
3) You need to understand what happens when the price gets out of your range and incorporate that into your strategy.
The High of your range is the price above which you have exhausted all your base inventory (e.g. BTC) and your position will be ~100% in quote asset (e.g. USDC). The Low of your range is the price below which you have exhausted all your quote inventory (e.g. USDC) and your position will be ~100% in the base asset (e.g. BTC).
This means with a CCL position, you are automatically averaging down on the base asset (e.g. BTC) as price moves down, and automatically taking profit in quote asset (e.g. USDC) as price moves up.
This is a feature, not a bug. You should set the high and the low of your range so that you get average buy and sell prices that you are happy with, and the Rujira UI makes it very easy for you by calculating those in real time as you update your range high and low.
For example, below I set a range on BTC/USDC between 50,000 and 125,000 USDC and start the position (~$10.6k total) when the price is at ~63,375 USDC with an inventory of ~0.120745 BTC and ~3,000 USDC (~72%/28.2%):
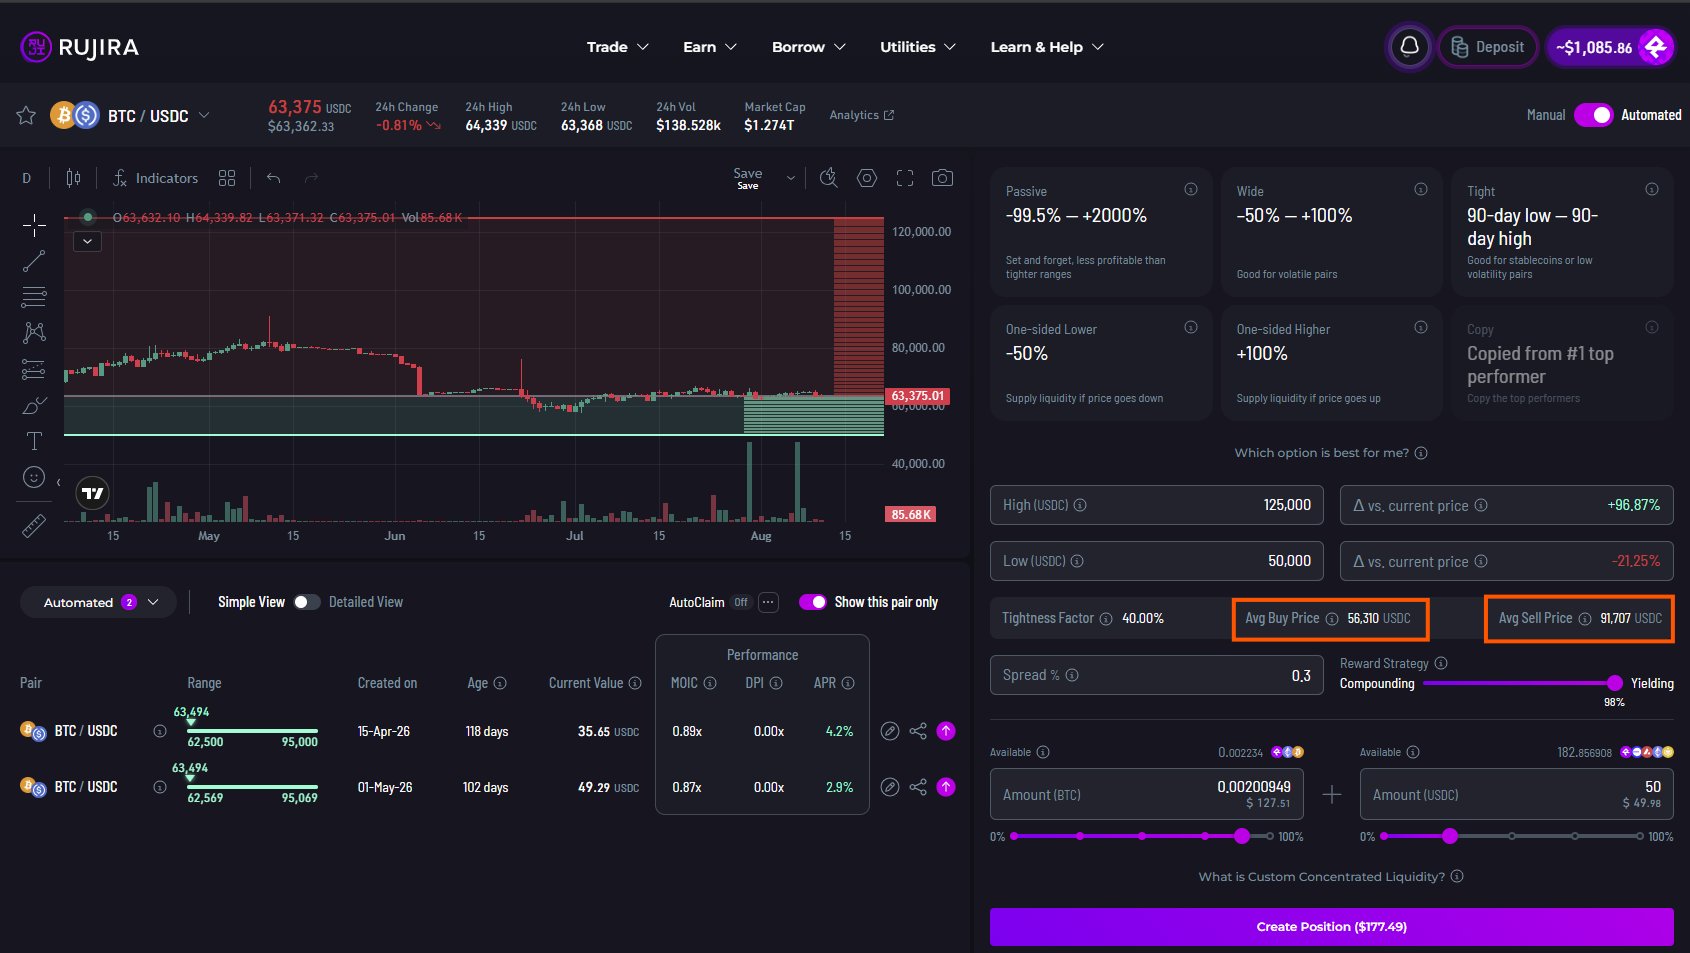
If the price drops below the bottom of my range, I will end up with ~0.174034 BTC and ~0 USDC (~100%/0%). I will have acquired an additional ~0.053289 BTC at an average price of 56,297 USDC. If the price moves above the top of my range, I will end up with ~0 BTC and ~14,071 USDC (~0%/100%). I will have sold my ~0. 120745 BTC inventory at an average price of 91,686 USDC.
I am happy with any of the 3 possible outcomes:
Because I am a long term BTC believer and I am happy to accumulate more at an average price of 56,297 USDC. But I am also a trader, and I am happy to take profit at an average price of 91,686 USDC and wait for price to pull back to reenter. Meantime, if price stays in my range, I will automatically be earning yield by trading the volatility.
Step 3: Set the Spread and Fee
Once you have chosen your pair and set your range, you have done the hardest part. The rest is just about setting up two simple parameters, which I will dig into, but the good news is that there are fairly clear answers for each.
1) Setting the spread
The spread is the percentage profit you target between your buy (bid) and sell (ask) orders.
RUJI Trade is an orderbook DEX, it allows traders acting as liquidity providers to use much more expressive strategies (like CCL) and make money from trading the volatility instead of deducting a fee directly from swappers like it’s usually the case for AMM-DEXs like THORChain or Uniswap.
At any price point inside your range, there will be a bid price at which you are willing to use a portion of your quote inventory (e.g. USDC) to buy the base asset (e.g. BTC), and an ask price at which you are willing to sell a portion of your base inventory for the quote asset.
Imagine the mid-price (average between the highest bid and the lowest ask in the orderbook) on the BTC/USDC pair is currently at 100,000 USDC. If you have set your spread to 0.20%, you will be willing to buy BTC at 99,900 USDC and sell at 100,100 USDC. As price moves, your orders get filled and the CCL algorithm automatically adjusts your positions. All else being equal, the more price moves back and forth inside your range, the more income you can generate by capturing the spread.
So, what’s an appropriate spread?
CCL is highly flexible: you could set a very tiny 0.01% spread, looking to trade at a high frequency and capture a very small margin on a large number of trades, or you could set a much wider 2% spread to configure your strategy more like a grid bot, trading larger price swings at a much lower frequency.
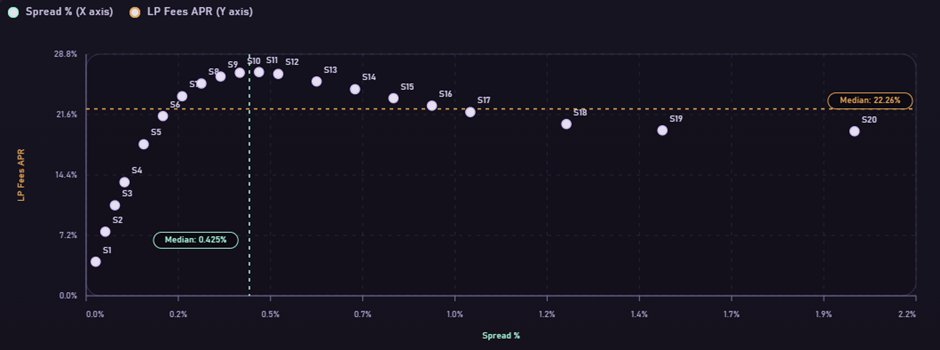
Based on these backtest, there appears to be a fairly clear sweet spot depending on the type of pairs you are interested in.
The backtest below shows the APR on the BTC/USDC pair on a wide range (50,000-150,000 USDC, tightness factor: 33.3%) at various levels of spread, from 2.5 bps to 200 bps. Again, ignore the absolute APR numbers, what matters is the shape of the distribution.
There is a clear sweet spot between 30 bps and 60 bps.
257-day backtest: BTC/USDC | Range 50,000-150,000 USDC | APR at various levels of spread (with fee = spread)
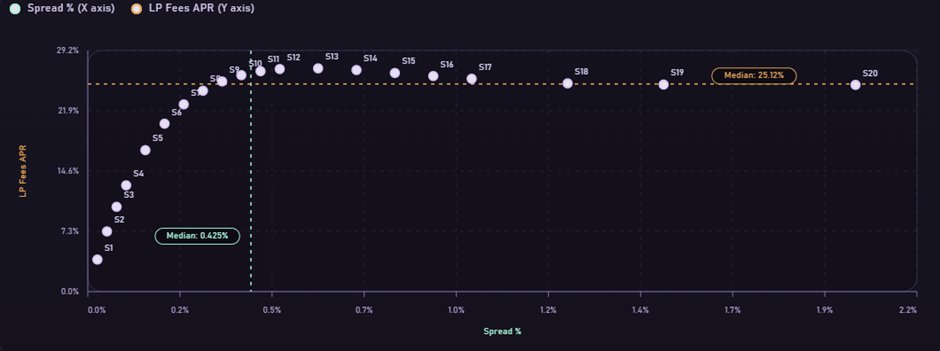
This is the same analysis on the ETH/USDC pair (1,500-4,500 USDC, tightness factor: 33.3%) and it points to a similar sweet spot around 40-60 bps.
258-day backtest: ETH/USDC | Range 1,500-4,500 USDC | APR at various levels of spread (with fee = spread)
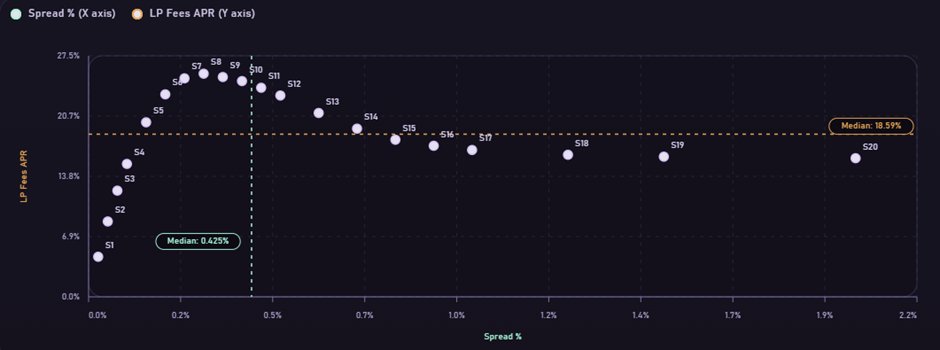
And here is a similar analysis but for a pair quoted in BTC instead of stablecoins, ETH/BTC (0.018-0.08 BTC, tightness factor: 22.5%) from 2.5bps to 200 bps. In that case, the volatility will be lower, and we should expect a tighter spread to yield better results, which is exactly what the analysis shows, with a sweet spot around 25-40 bps.
250-day backtest: ETH/BTC | Range 0.018-0.08 USDC | APR at various levels of spread (with fee = spread)
But looking simply at the APRs over the full backtest period doesn’t tell the full story. Let’s dig a bit deeper.
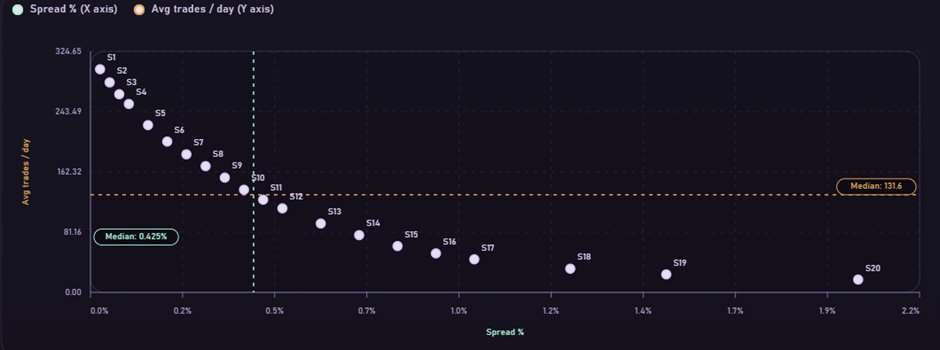
First, another interesting analysis to look at is the number of trades taken at various levels of spread. The chart below shows that analysis for our BTC/USDC wide range (50,000-150,000 USDC) from 2.5bps to 200 bps. As you would expect, the average number of trades per day is a direct function of the spread: the wider the spread, the more price needs to move to trigger a trade and the fewer trade per day. The average number of trades drops from ~300/day at 2.5bps to only ~17/day at 200 bps.
257-day backtest: BTC/USDC | Range 50,000-150,000 USDC | Average number of trades per day at various levels of spread (with fee = spread)
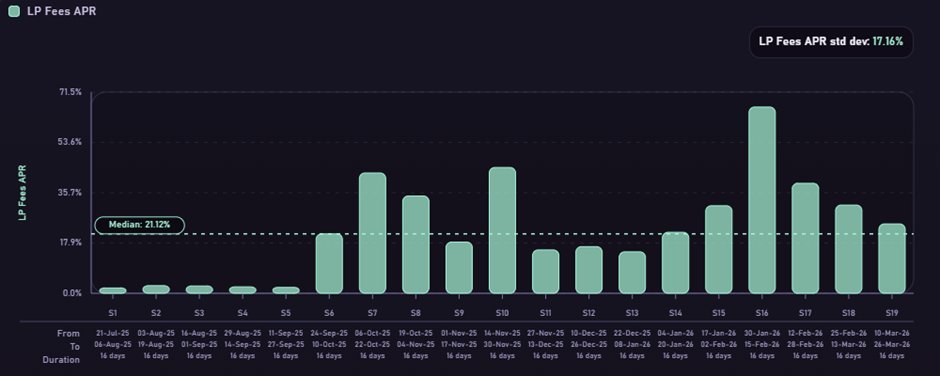
This means APR will likely be more consistent with lower spread. Let’s check in the next analysis. Below we compare two identical scenarios except for the spread, one with 20 bps spread and the other with 100 bps. We divide our 257 days backtest period into 19 sub-periods of ~16 days with 20% overlap from one sub-period to the next (the overlap allows us to smooth the results and have more datapoints to observe).
This is the 20 bps scenario:
257-day backtest split into 19 sub-periods: BTC/USDC | Range 50,000-150,000 USDC | Spread = Fee = 20 bps | APR over time
And this is the 100 bps scenario:
257-day backtest split into 19 sub-periods: BTC/USDC | Range 50,000-150,000 USDC | Spread = Fee = 100 bps | APR over time
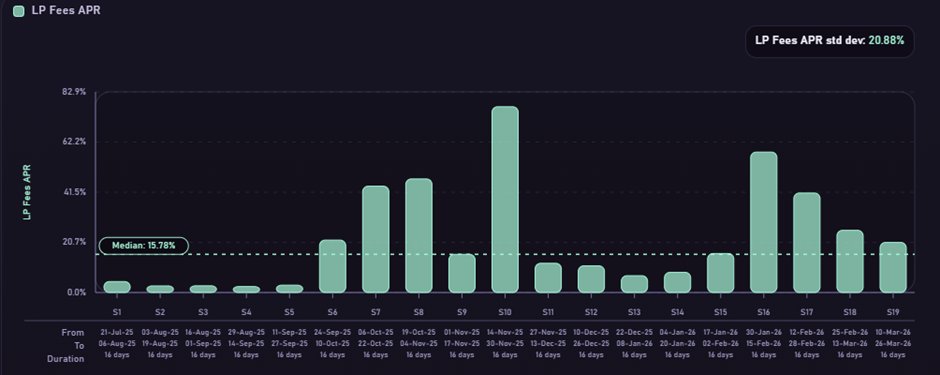
Both scenarios have almost exactly the same APR of ~21% over the full period. However:
20 bps scenario has a significantly higher average # trades per day (~203 vs. ~44) 20 bps scenario also has a higher median APR across sub-periods (21.1% vs. 15.8%) and a lower dispersion of returns (standard deviation of 17.1% vs. 20.9%)
This confirms the intuition that tighter spread / higher frequency strategies have more consistent returns over time.
To conclude on the spread, we can sum up those analyses into a few guiding principles:
For higher volatility pairs quoted in stablecoins, like BTC/USDC and ETH/USDC, backtests point at a sweet spot around 30-60 bps. For lower volatility pairs quoted with a correlated crypto, such as ETH/BTC, backtests point at a sweet spot around 25-40 bps. I have excluded highly correlated pairs like USDT/USDC or wBTC/BTC from the analysis due to lack of reliable data at this stage; I will come back to that in the future. The wider the spread, the lower the frequency of trading and the less consistent the APR over time. Parameter selection should strike the right balance between maximizing yield and consistency of returns over time. Everything else being equal, it is generally better to favor a lower spread to improve consistency.
2) Setting the Fee
The Fee is the profits from the spread that you wish to retain as claimable yield, separated from your principal. It can be set to any value between 0 (profit 100% compounded inside the position) and the 98% of the Spread (almost all the profits are claimable as yield).
Note: We are enforcing the limit to 98% of the spread to avoid any capital leaking out of your principal due to rounding; the remaining 2% will be compounded inside your position. For simplicity, I say throughout the article that Fee = Spread, but it's actually Fee = 0.98 * Spread.
If you create a position with a spread of 30 bps, you can set a fee of up to 30 bps (well 29.4 bps in reality, you got the picture).
Due to smart contract limitations, Rujira can only track the yield and APR of your position if you use a positive fee. So, unless you have a good reason to do otherwise, the best default is to set the fee to the same value as your spread. This will give you the best analytics.
If you prefer to let the yield compound inside your position natively, for example, because of tax considerations, you can set the fee to 0. You will still be able to track the total performance of your position by looking at the Money Multiple (MOIC), but you won’t be able to differentiate between the trading PnL from your principal and the profits you earned from the spread.
Step 4: Create your position
To create a CCL position, visit RUJI Trade, select the pair you want to trade (e.g. BTC/USDC) and activate “Automated” with the toggle at the top-right of your screen.
You can use some of the pre-set options, but I would highly recommend using the info in this guide to set your own parameters and create a position that fits your views of the market and investment horizon.
Once you are happy with your parameters, make sure your wallet is connected and select how much you want to put at work. Depending on the range you choose, you will need to deposit a specific amount of base and quote assets together, so make sure you have enough of each deposited on Rujira, then click “Create Position” and sign the transaction.
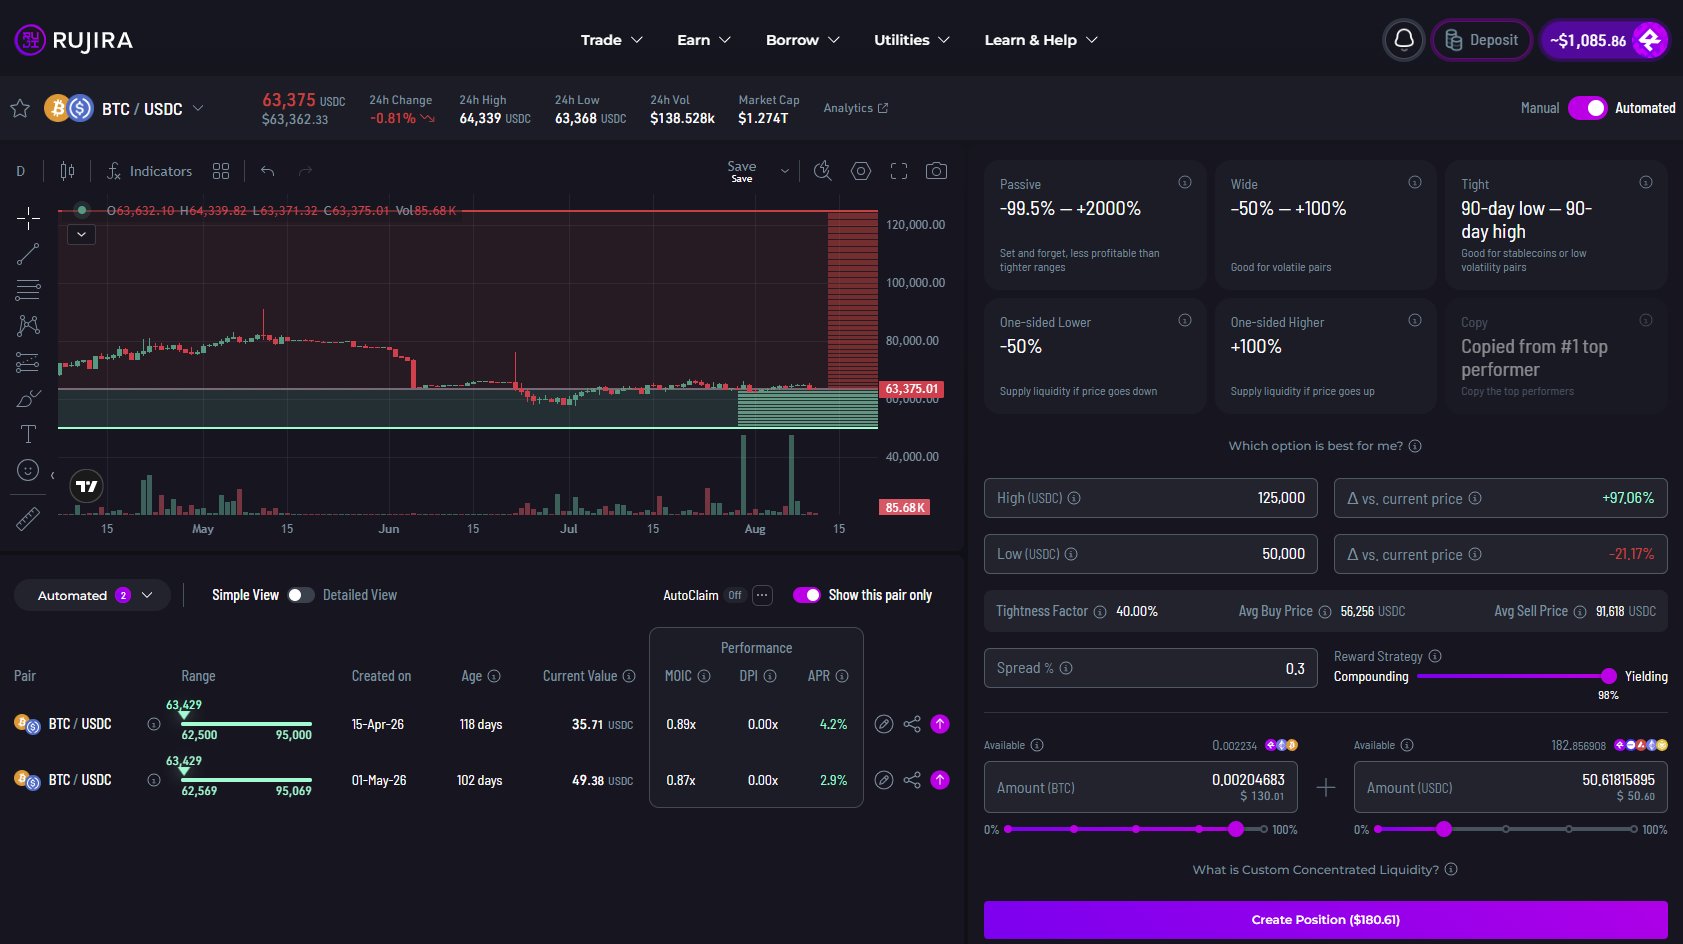
The amount you deposit is your Principal. The quantities of base and quote that compose your principal will fluctuate as price moves inside your range.
If you have set the fee equal to your spread, you will be able to claim your trading profits separately and build an income stream that way.
That’s it, you are all set. All that is left is periodically monitoring the performance of your position.
Step 5: Monitor the performance of your position
Like with any business, measuring and monitoring your performance is key to good decision making and long-term success. Rujira has tools built in to help you with that, let’s walk through.
Position Tracking Dashboard
You can follow the performance of your positions either directly from the RUJI Trade interface, or from your portfolio page, under the “Orders” category, “Automated” tab.
The dashboard offers a Simple View summarizing the key metrics, and a Detailed View with more granular information. From there you can see for each position: the range, the parameters, the date of creation, the age, and the total amount invested measured in quote asset (e.g. USDT). Next to that, you got the key performance metrics, we will review them in detail.
The age is a weighted average: if you deposit more funds, or withdraw some during the life of your position, this will be reflected in the age. The weighted average age is key to calculate the APR.

Realized and Unrealized Value
On the Detailed View, you can see all the values that are used to calculate the performance of the position. Everything is measured in quote asset, so if you are trading BTC/USDT, your performance will be measured in USDT; if you are trading ETH/BTC, your performance will be measured in BTC. The quote asset is always the reference currency. For Total Invested and Realized values, any value in base asset is converted to quote using the price at the time the investment is made or realized.
This part comprises four values divided into two categories:
Realized Value:
Withdrawn --> This is the total value you have withdrawn from your Principal throughout the life of your position. Claimed Yield --> This is the total value of trading profits you have claimed during the life of your position. If you have set the Fee to 0, this field will always be 0, which is why I recommend always setting the Fee equal to your Spread.
Unrealized Value:
Current Value --> This is the current value of the Principal (base + quote inventories) remaining in your position. If you withdraw it all, this value will become 0. Unclaimed Yield --> This is the value of the trading profits you haven’t claimed yet. If you have set the Fee to 0, this field will always be 0.
Those values allow us to measure three key performance metrics: MOIC, DPI and Yield APR.
MOIC
This is the Multiple On Invested Capital. It’s a standard metric in traditional finance which measures the total performance of your investment. It is calculated as: MOIC = (Realized Value + Unrealized Value) / Total Invested Any value above 1.00x means you are in profit. It is a convenient way to express the performance as a multiple of your investment, but it’s effectively the same as looking at the % change in value, just subtract 1 and you have the performance in percentage (i.e. a MOIC of 1.05x is the same as a 5% gain on your investment). If you have set the Fee to 0, this will be the only way to measure the performance of your position since the profits you are making will be directly added to your Principal.
DPI
This is the Distributed to Paid-In ratio. It is a standard measure of realized performance. It is calculated as: DPI = Realized Value / Total Invested Imagine you claim $5 of yield on a $100 investment, this will bring your DPI to 0.05x, which means you have recovered 5% of your investment from that yield. Any withdrawal you made from your Principal is also factored into your DPI. From the moment your DPI reaches 1.00x, this means you have recovered the value of your initial investment. Anything past that is pure gains.
Yield APR
This is the estimated Annual Percentage Return you have earned from claimable trading profits during the life of your position. Note that, if you have set the Fee to 0, this value will always be 0. It is calculated as: APR = ((Claimed Yield + Unclaimed Yield) / Average(Total Invested, Unrealized Value)) / Weighted Average Investment Age in days * 365 The APR measures the income you generate from trading profits, while ignoring the fluctuations in value of your Principal which occur as ordinary course of business.
Monitoring
As an astute business owner, you should monitor those metrics periodically. Key things to check:
Make sure all your positions are still in range; decide what to do with the ones that moved out of range. Claim your yield if a meaningful amount has been accruing, and decide what to do with it (e.g. take it out to complement your income, reinvest, or repay debt if you have been using leverage). Check if the APR is roughly in line with your expectations, and how it compares to your other positions. If the value is lagging, it might be worth closing the position and creating a new one with different parameters, or choosing a different pair. Check that you are still happy holding any of the tokens in the pairs you are trading. If not, for example because of some fundamental changes that have altered your conviction, it’s a good time to re-evaluate which exposure you want and rebalance your portfolio accordingly.
A word on distribution of returns over time
Don’t be too fast to judge the performance of a position, particularly the APR. The returns you generate with CCL strategies are a direct function of volatility. Volatility tends to be cyclical, with quiet periods (weeks, sometimes months) without much fluctuation, suddenly followed by periods of high volatility (often shorter, more intense).
Working through a sub-period chart is a good mental exercise to understand that returns can swing widely from one period to the next and help set expectations (again, in term of the distribution of returns, not absolute value).
This is a 258-day backtest for ETH/USDC divided into 19 sub-periods of ~17 days. You can see how quiet periods follow active periods with wide swings in APR from one window to the next - the highest APR during the period is ~13x the lowest.
258-day backtest split into 19 sub-periods: ETH/USDC | Range 1,500-4,500 USDC | Spread = Fee = 50 bps | APR over time
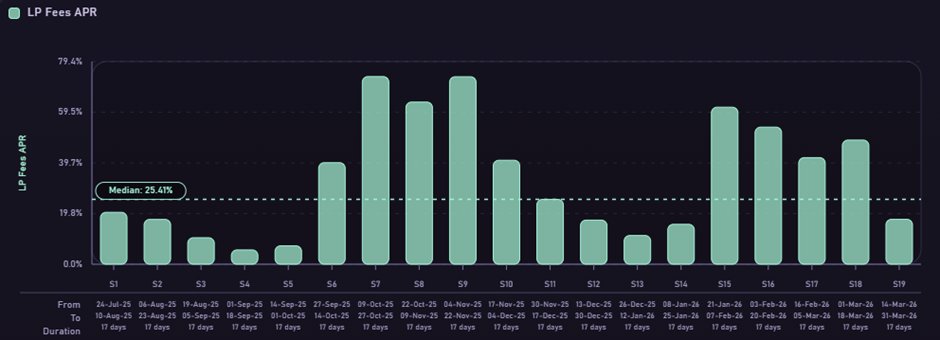
That’s another reason I tend to favor wider ranges: they maximize the time your position stays actively trading and improve your chances of catching those big volatility periods.
That’s it for today, I hope this is helpful and will inspire many of you to try CCL out.
Happy trading everyone!
Sources and Further Reading
Original source: A Primer on Rujira’s CCL Strategies, Part 2 by Pragmatic Monkey
Read Part 1: A Primer on Rujira’s CCL Strategies, Part 1: Democratizing Access to Market Making